From address to a finished proposal in minutes.

An AI-drawn roof, your prices, your PDF — and a link your client can run on their own.

Free during the pilot · no card · Swedish starter kit

Type your address. We draw the roof and estimate the panels and savings.

What is Numsolar?

  • Calculate.

    Type the address. The roof is drawn in 3D from aerial imagery, the panels are placed and the whole year is simulated hour by hour — with battery and strategy.

  • Price.

    Your packages, your price list, VAT and grön teknik by your own rules. The Swedish starter kit is there from day one.

  • Sell.

    A PDF in your own template, a link with your name the client keeps working on, and the request straight in your inbox.

1 · The configurator, step by step

Send your client a link. They see only you, your price and their own roof.

  1. The start page of the client link: Demo Sol AB at the top and an address field.

    The address

    Your client opens your link and types their address. We find the house on the map with Google.

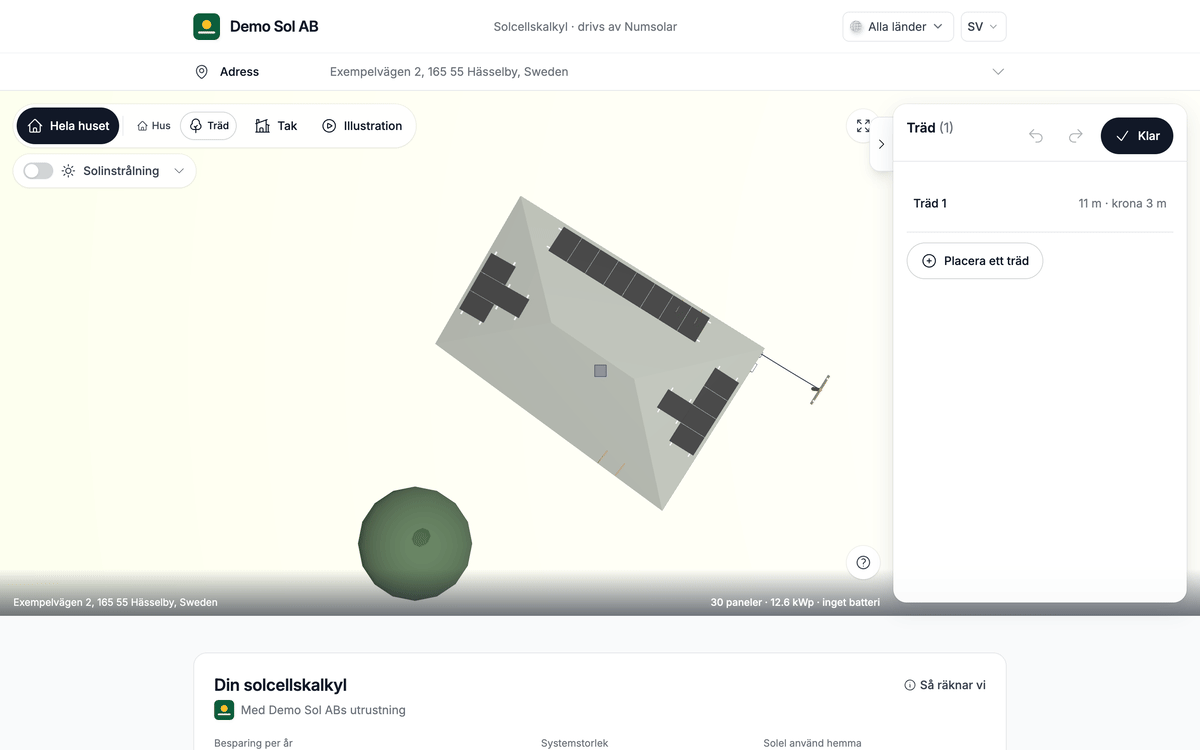
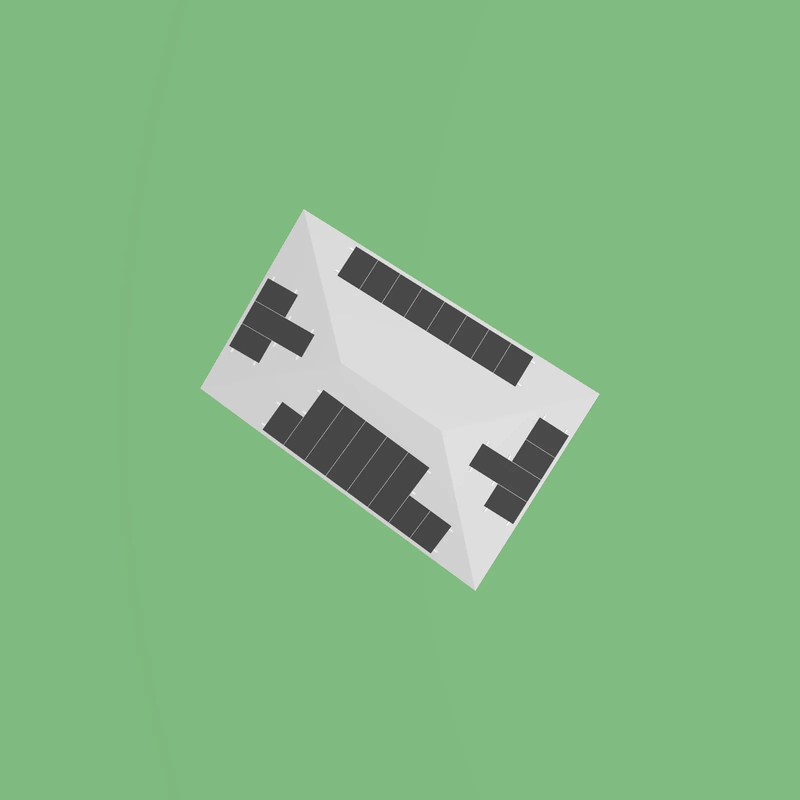
  2. The house in 3D on the aerial photo, with the trees around it.

    The roof, drawn by AI

    An AI model finds the roof faces on Google's aerial photo. We rebuild them in 3D and look for chimneys, skylights and trees nearby.

  3. One roof face in the editor: east, 45°, about 16 m wide, with the edge margin and a skylight.

    Roof faces and panels

    Each roof face gets its tilt, direction and size; your client can change the tilt or the roof material. The panels go on the faces that point south, east or south-west, with a margin from every edge and roof object.

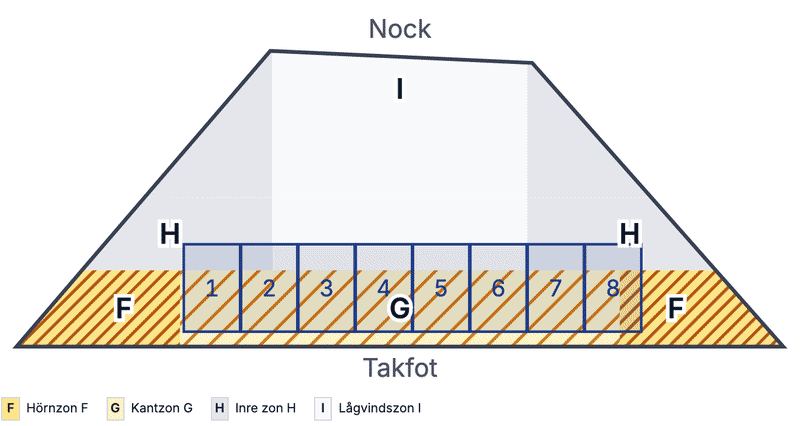
  4. The Snow & wind pane: snow on the ground, wind speed, the terrain around the house and the load zones of a roof face.

    Snow and wind

    Snow and wind loads come from Boverket's EKS maps for the house's location. It is an estimate; you confirm it.

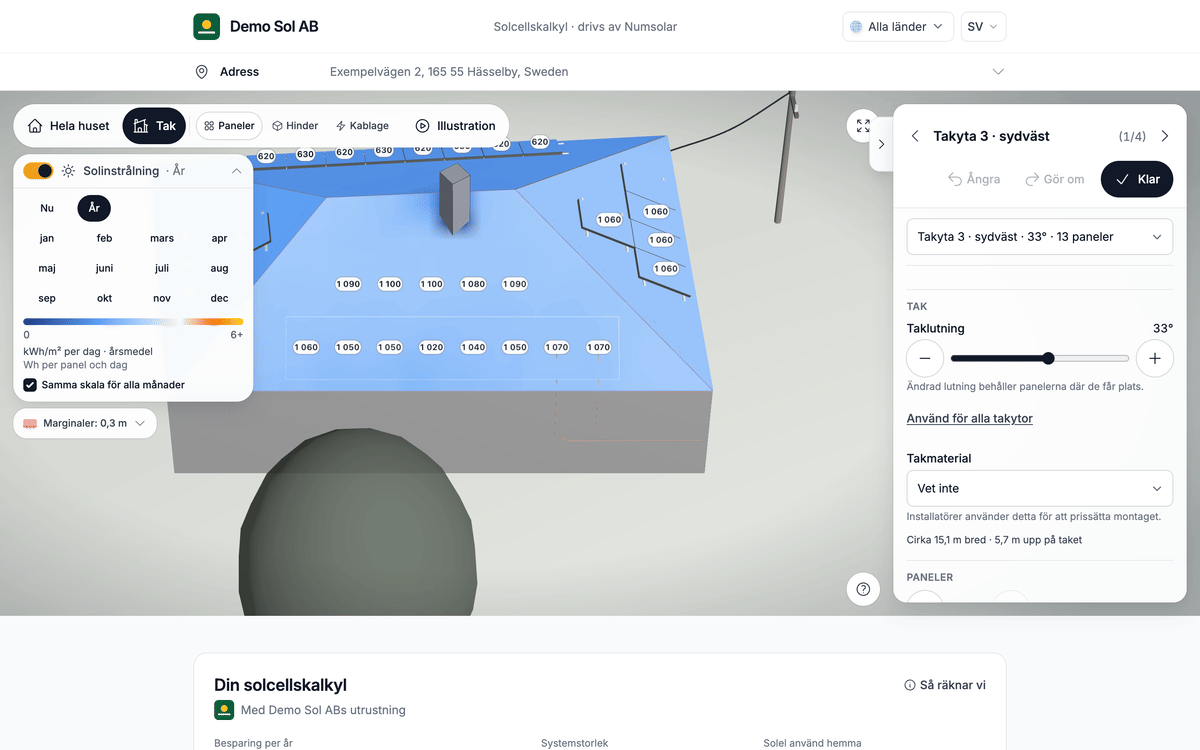
  5. The Radiance view: the roof coloured by sunlight, with each panel's production per day.

    Shade from trees and roof objects

    We follow the sun through the day and check what shades each panel: trees, roof objects and the house itself. A tree crown lets 15% of the light through, and Radiance shows what each panel produces.

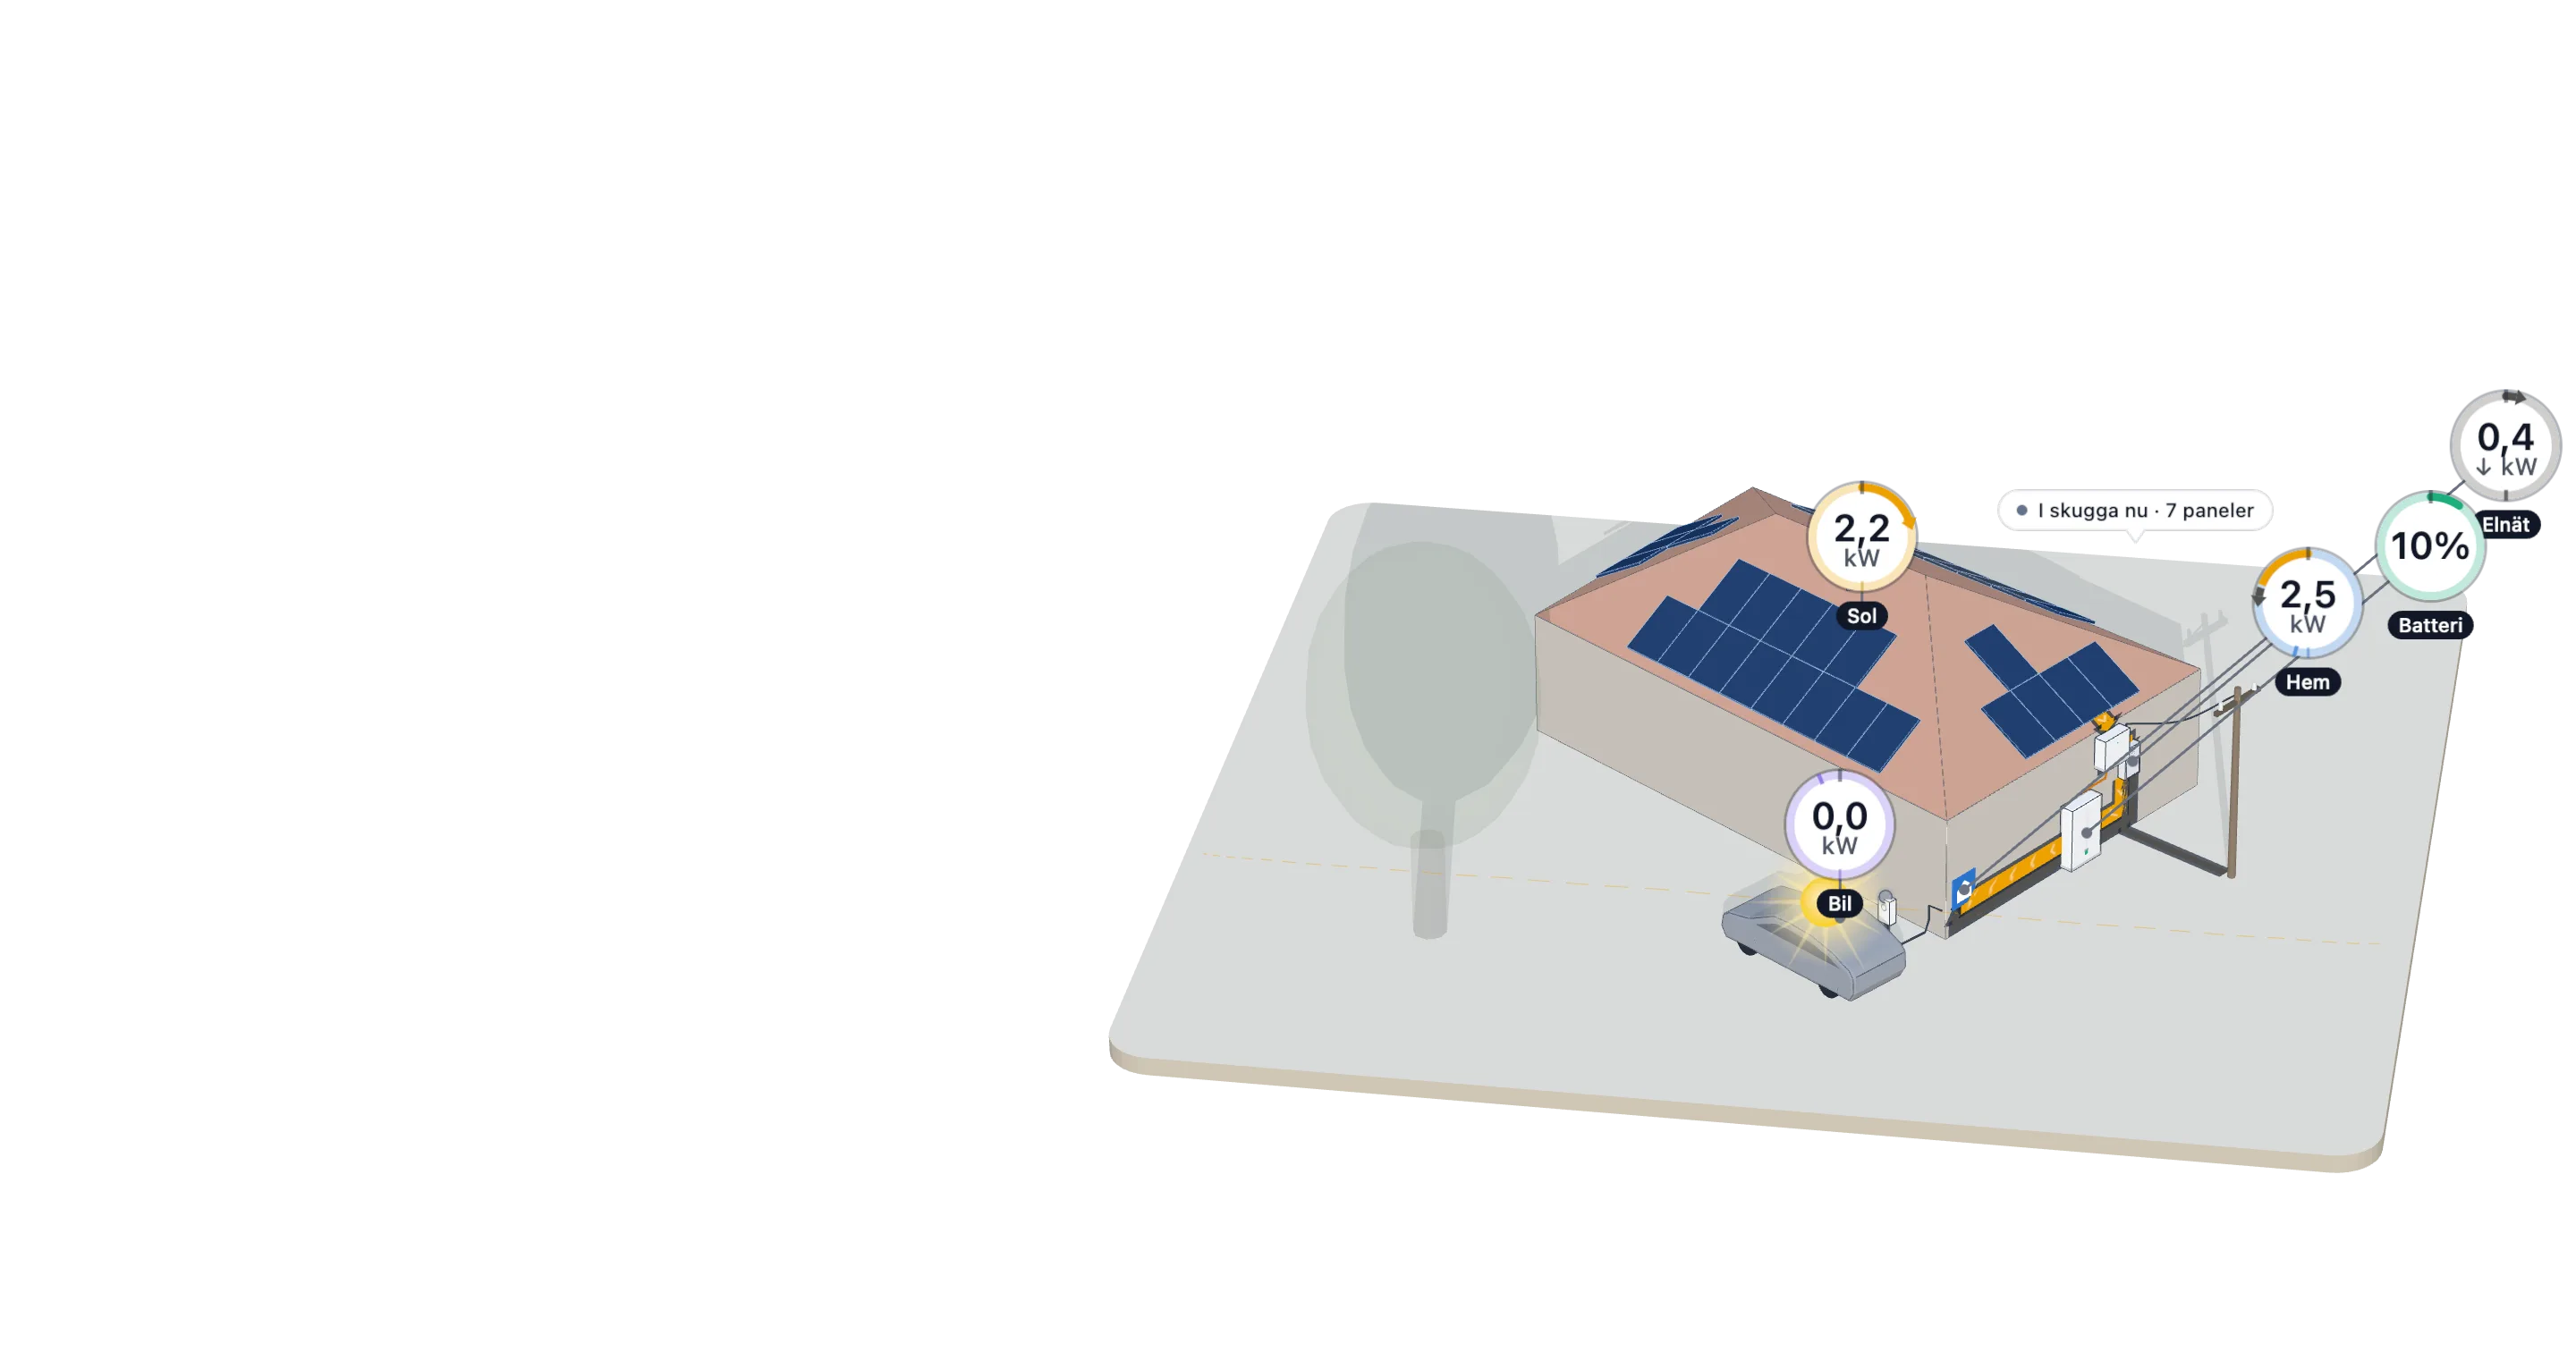
  6. A typical June day: the household's use, the solar production and the electricity price, hour by hour.

    A year of solar, hour by hour

    We simulate the system hour by hour over a typical year, with one typical day per month. In Sweden the sunlight and temperature of each month come from PVGIS data for the area. Your client can set their own use per month and per hour.

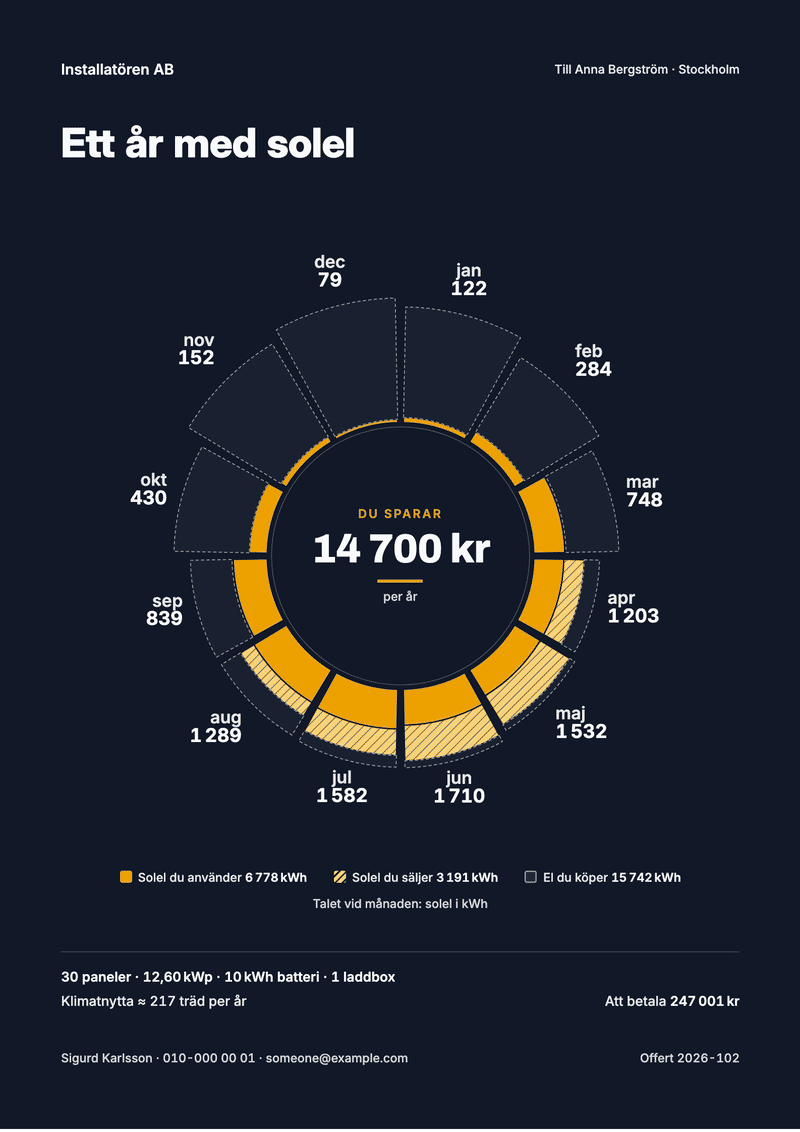
  7. How the electricity flows over a year: solar used at home, sold to the grid and bought, in kWh and kronor.

    The savings, in kronor

    Each hour gets its price: the average spot price for that hour and month in the client's price area over the last year, plus markup, grid fee, energy tax and VAT. Solar used at home saves that price, solar sold earns the sell price — a battery and an electric car are simulated the same way.

  8. The price card from Demo Sol AB: the total incl. VAT after the green-tech deduction, payback, warranties and equipment.

    Your price, after the deduction

    The price comes from your own price list, VAT included, after the green-tech deduction; payback is the price divided by the first year's savings. Our Swedish starter price list follows Skatteverket: 15% for solar and 50% for a battery, of 97% of the cost, at most 50 000 kr.

  9. The request form: name, email or phone, consent and "Send to Demo Sol AB".

    The request, in your inbox

    Your client leaves a name and an email or phone number. You get an email, and the client, the 3D roof and an offer at the same price arrive in your Numsolar account.

  10. See your own roof

    It takes about a minute. Free, no account.

Screenshots of the configurator with a test house and a made-up installer, Demo Sol AB.

Example

Example Solar AB

128 000 SEK

incl. VAT, after grön teknik

  • Installation in about 6 weeks
  • about 9 years payback
  • Warranty: panels 25 years · workmanship 10 years

2 · The API — the same engine, open, no key

Solar yield

Stockholm · 35° · 180° · 9.24 kWp

983 kWh/kWp · 9,085 kWh/year

GET /api/v1/pv-yield?lat=59.33&lng=18.07&tilt=35&azimuth=180&kwp=9.24

Battery and strategies

15,000 kWh/year · Battery sizes: 0 / 5 / 10 kWh

10 kWh · Own solar first — charge with surplus, use in the evening · SEK 2,600/year

Yearly savings from the battery compared with no battery, at SE3 spot prices. The numbers come from the API response.

POST /api/v1/simulation/battery-strategies

Full documentation OpenAPI

Facts, not promises

  • The yield model is compared with PVGIS 5.3 at 39 points in Sweden: 35° south within ±5 % at every one.

    Full documentation
  • Compared with 15 real installations.

    /validations
  • An open API with no key. All simulation runs on our own servers.

3 · The template gallery

28 offer templates · 3 technical templates

4 · Electrical schematics

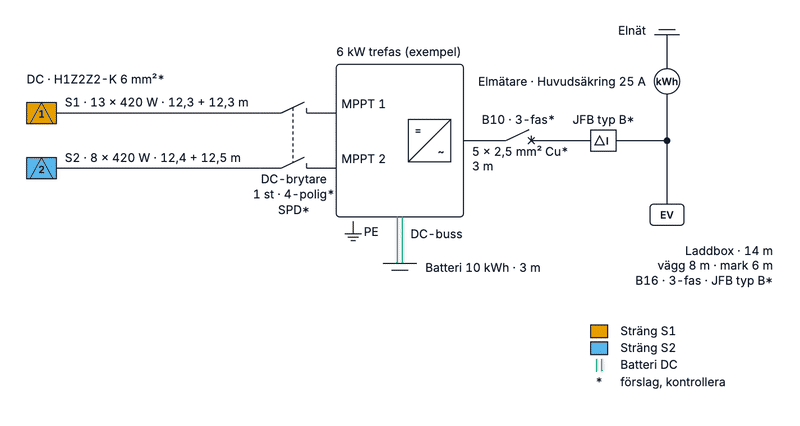
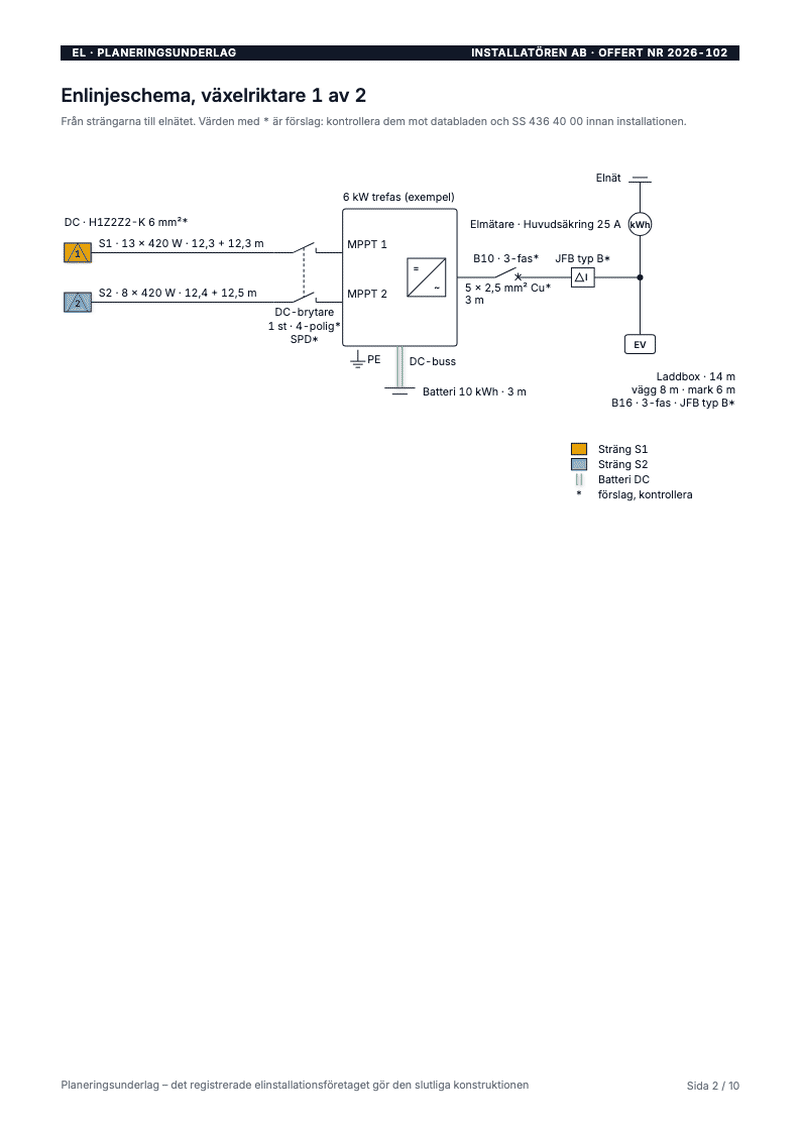
What the electrician gets from the same roof: a single-line diagram per inverter, strings that follow the shade and a voltage check in cold and heat.

  • A single-line diagram per inverter

    Strings and panel counts, Voc and Isc at the design temperatures, protection, cable types and lengths, battery, EV charger and the grid.

  • Strings that follow the shade

    The plan uses the sun, the trees and the obstacles on the roof to group the panels and to suggest how many strings to use.

  • A voltage check in cold and heat

    The string voltages on the coldest and the hottest design day, checked against the inverter's limits.

  • A Stringing report PDF for the electrician

    A summary, roof sketches with the series order, the conditions, the equipment and the cables.

Data: sample house 2, Large house + battery + EV

Example data. A planning estimate: the registered electrical installation company makes the final design.

Sample house Download PDF

Snow and wind loads for every Swedish roof

The snow load (s_k) and the wind speed (v_b) of each place in Sweden, on one map. Hover or tap the map, or try a place.

Examples

  • Malmö: snow 1.0 kN/m² (≈ 102 kg/m²), wind 26 m/s
  • Göteborg: snow 1.5 kN/m² (≈ 153 kg/m²), wind 25 m/s
  • Stockholm: snow 2.0 kN/m² (≈ 204 kg/m²), wind 24 m/s
  • Östersund: snow 2.5 kN/m² (≈ 255 kg/m²), wind 23 m/s
  • Kiruna: snow 3.0 kN/m² (≈ 306 kg/m²), wind 22 m/s

What it means for your quotes

Each roof face gets its snow and wind load per roof zone. Your packages get the panels per load range. So your quote picks the right mounting automatically.

  • · The load per roof zone: edge, corner and middle of each face.
  • · The values show on the offer and on the project page.
  • · No map reading by hand before each quote.
Create a free account

Based on Boverket's EKS 11 maps (BFS 2019:1). These are estimates: the installer confirms on site. Hatched areas are less certain. Län borders: Natural Earth.

How to get started

  1. Claim your listing (5 minutes)

    Confirm your company with your work email. No card, no contract.

  2. Add your prices

    We give you a Swedish starter package to adjust: panels, inverter, battery, labour, VAT and grön teknik.

  3. Get requests

    Homeowners near you send their request with the roof, the system and the estimate — straight to your email and to Numsolar.

Create a free account

Listing your prices and receiving requests is free while we run the pilot. We'll tell you well in advance before anything changes.