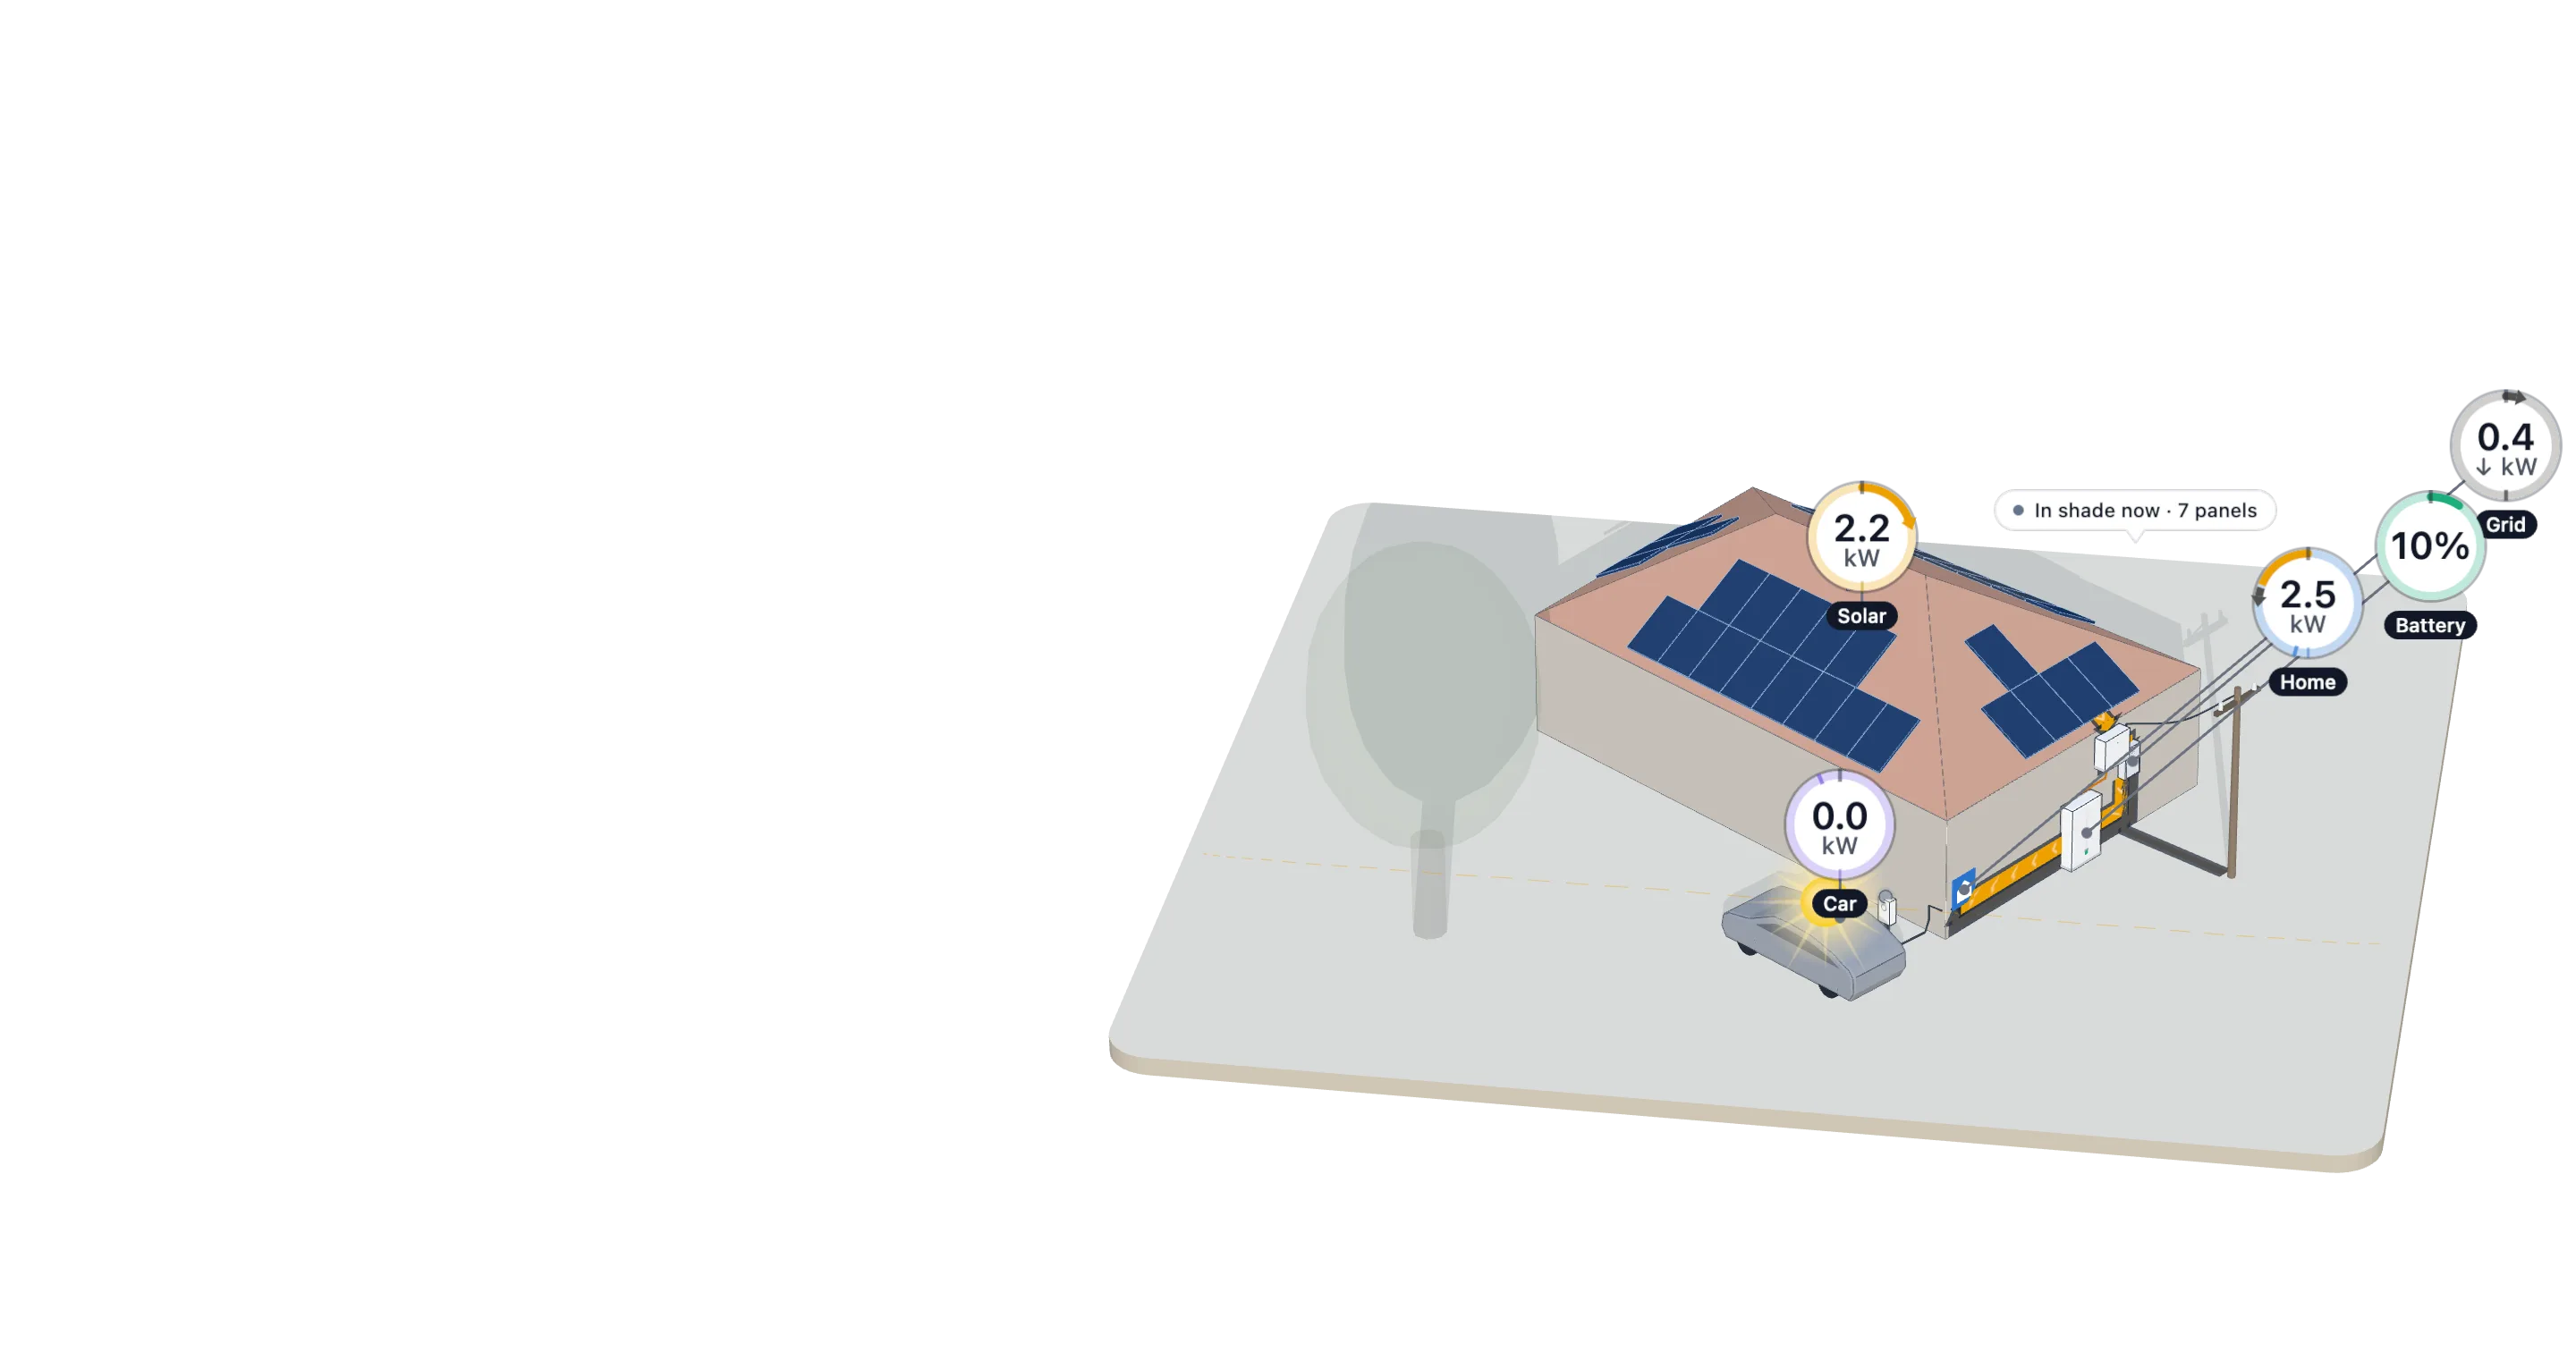
Your browser cannot show the 3D view. The picture shows the same house; the slider still changes the numbers.
12:30
Numsolar draws the roof in 3D from an address, follows the sun and shade every 15 minutes and prices the electricity at the last 12 months' spot prices in your price area.
Example
For homeowners
What do solar panels give on your roof?
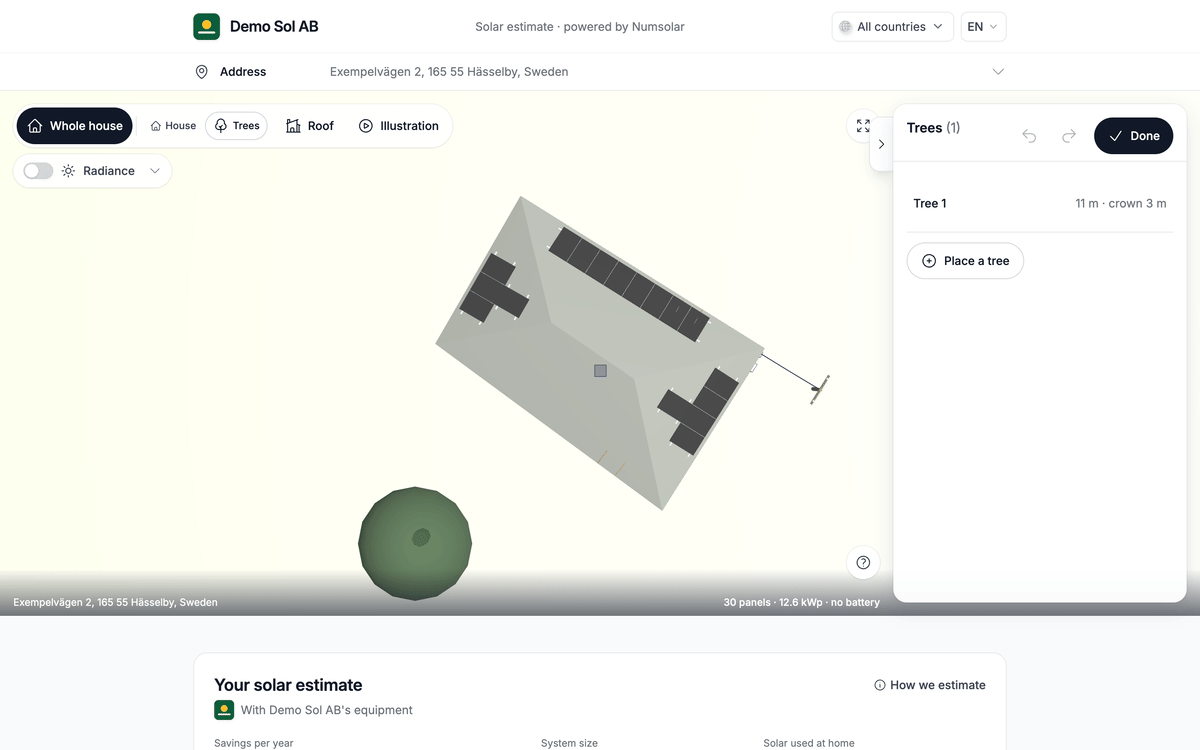
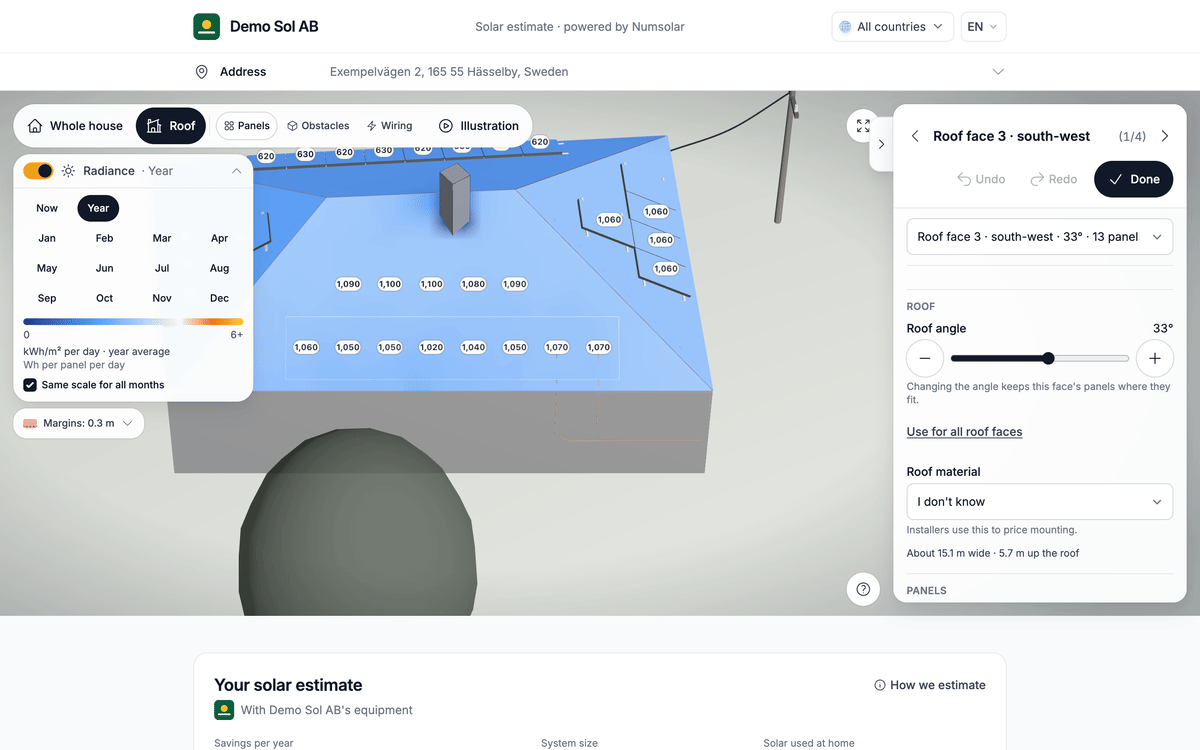
Your roof in 3D from the aerial photo, with the panels placed and a year of production.
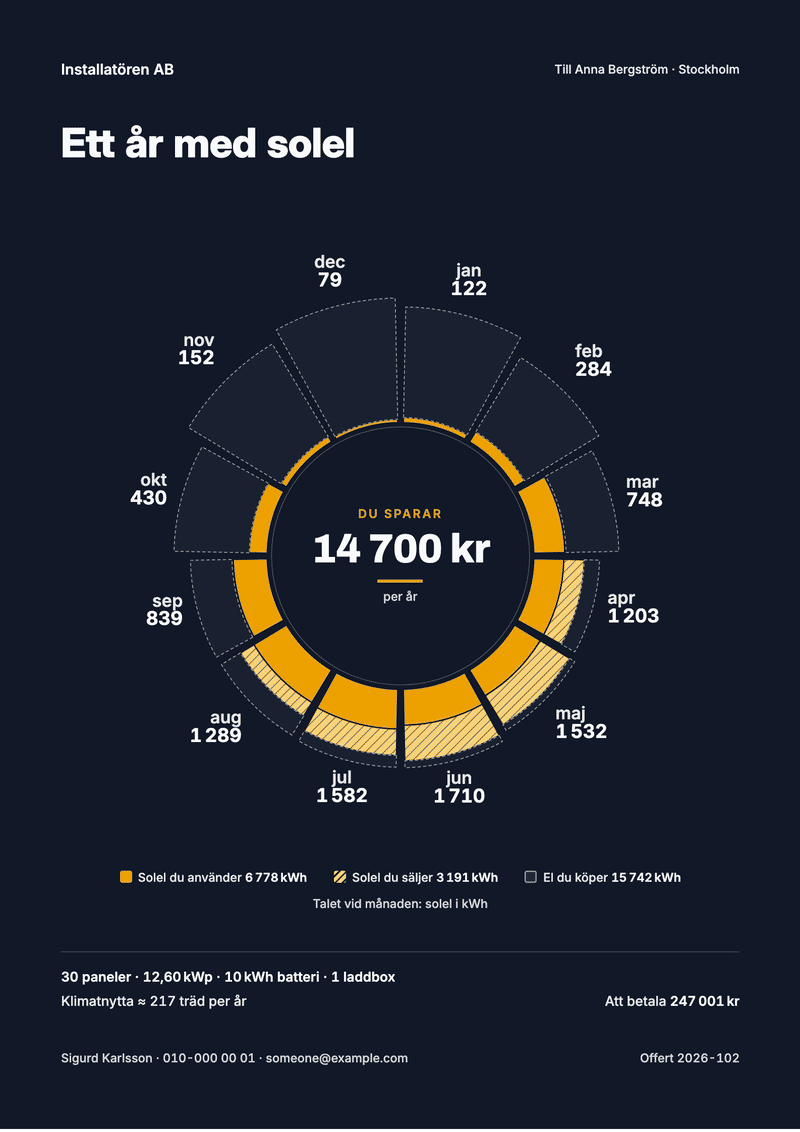
Estimated savings per year at your area's electricity prices, with and without a battery.
Every price after the grön teknik deduction.
Prices from installers that serve your address – you choose who gets your request.
Measured solar data (PVGIS), sun and shade every 15 minutes, the last 12 months' spot prices in your price area, battery strategies, your consumption pattern and electric cars.
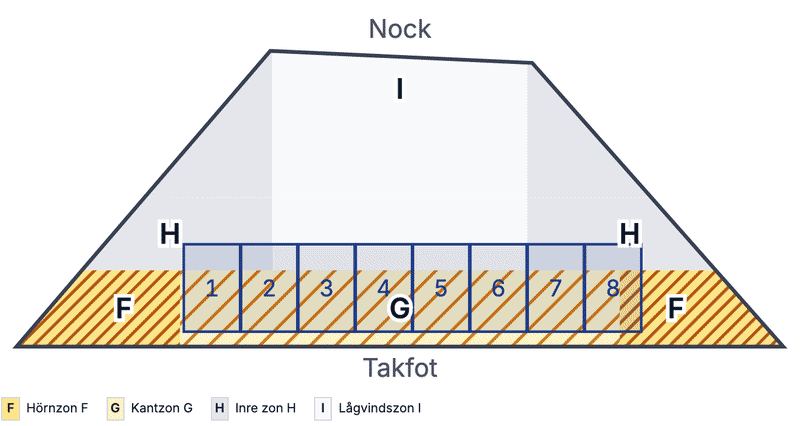
EKS 11 zones at the house's position, per roof face. Price the mounting by load range in your package rules. An estimate for a quote, not a structural calculation.
Depends on the roof. Type your address: listed installers price the system for your roof in about a minute, after the grön teknik deduction. The card shows the total, the payback in years and the warranties.
How much electricity do solar panels produce in Sweden?+
A house with 20 panels on a 35° south roof makes about 8,300 kWh a year in Stockholm – worth about SEK 15,000 at the last 12 months' electricity prices. Your roof's tilt, direction and shade move the number; the estimate uses all three.
City
Panels
kWh a year
Worth a year
Malmö (SE4)
20
8,900
SEK 18,000
Stockholm (SE3)
20
8,300
SEK 15,000
Luleå (SE1)
20
7,900
SEK 11,000
20 panels × 420 W = 8.4 kWp on a 35° south roof; PVGIS data, 14 % system loss. Worth: the price area's average spot price over the last 12 months plus markup, grid fee, energy tax and VAT. Prices as of 2026-10-14.
Does my roof have to face south?+
No. A 35° east or west roof makes about 76 % of a south one in Stockholm. We place panels on faces that point south, east or south-west and show each face's yield.
What is grön teknik?+
A tax reduction taken off the invoice: 15 % for solar panels, 50 % for a battery or an EV charger, at most 50 000 kr per person and year. Our prices are after the deduction.
How do you make a 3D model of my roof?+
An AI model reads the aerial photo and marks the roof faces, chimneys, skylights and trees. We rebuild the faces in 3D with their tilt, direction and size. You can correct any of it.
Should I add a battery?+
Try it: the estimate simulates 5, 10, 15 and 20 kWh with four strategies over the whole year at your prices and shows the saving per year for each size. The installer cards price each size after the 50 % deduction, so the payback per size is on your card.
Does it cost anything, and do I commit to anything?+
No and no. No account, no card, no call. A request goes only to the installers you tick, and the installer answers you by email.
Where do the numbers come from?+
Sunlight and temperature: PVGIS. The roof: Google's aerial photo and an AI model. Prices: the last 12 months of day-ahead spot prices in your price area, plus grid fee, tax and VAT. Loads: Boverket's EKS maps. Installer prices: each installer's own price list. The method is public: the same engine runs behind our open API.
Example
Cookies for visitor statistics
We use Google Analytics to count visits. It sets a cookie only if you accept. Server-side statistics without cookies run either way.
Privacy policy