Solar panels for your house: what they cost, what they give back
Type your address. We draw your roof in 3D from the aerial photo, place the panels, run a year of sun and shade in 15-minute steps and price the electricity at your area's rates. Then every listed installer that serves your address prices the system for your roof.
No account · about a minute · you choose which installers hear from you
Your browser cannot show the 3D view. The picture shows the same house; the slider still changes the numbers.
12:30
What we calculate for your roof
Example
Your roof in 3D
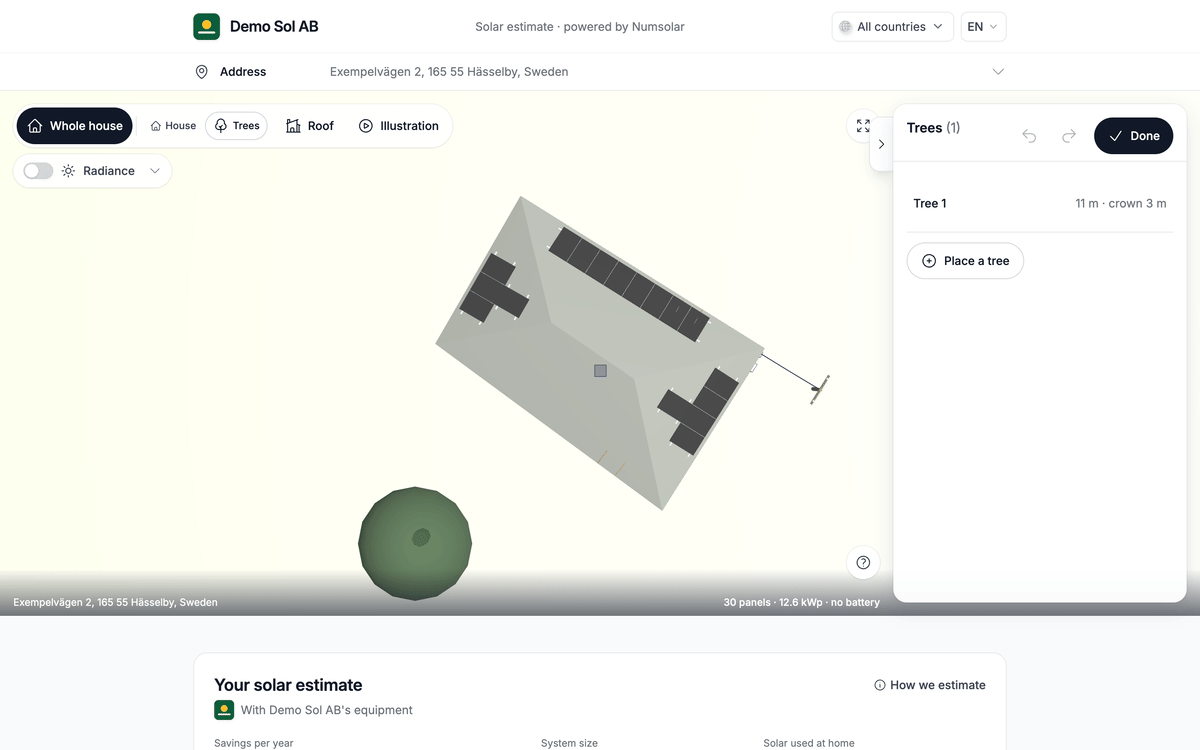
An AI model reads the aerial photo and finds each roof face, chimney, skylight and nearby tree. We rebuild the house in 3D: every face gets its tilt, direction and size. You can move a tree, change the roof material or the tilt, and the numbers follow.
Example
The sun every 15 minutes
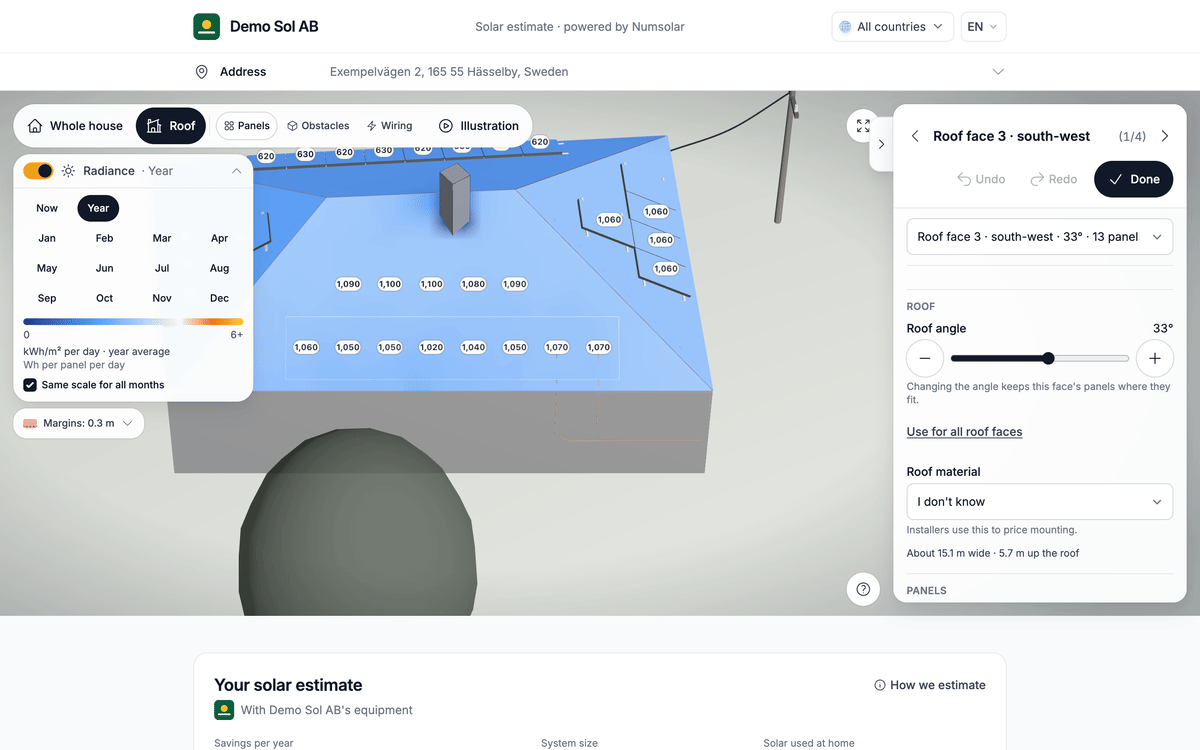
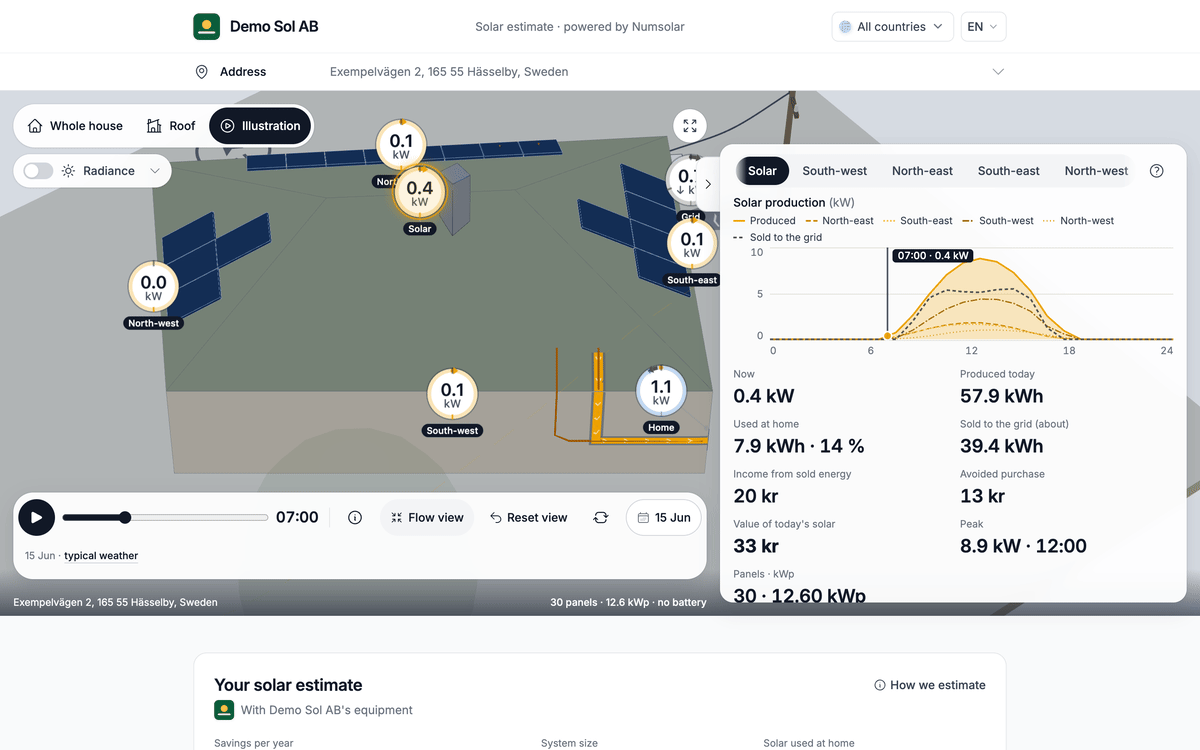
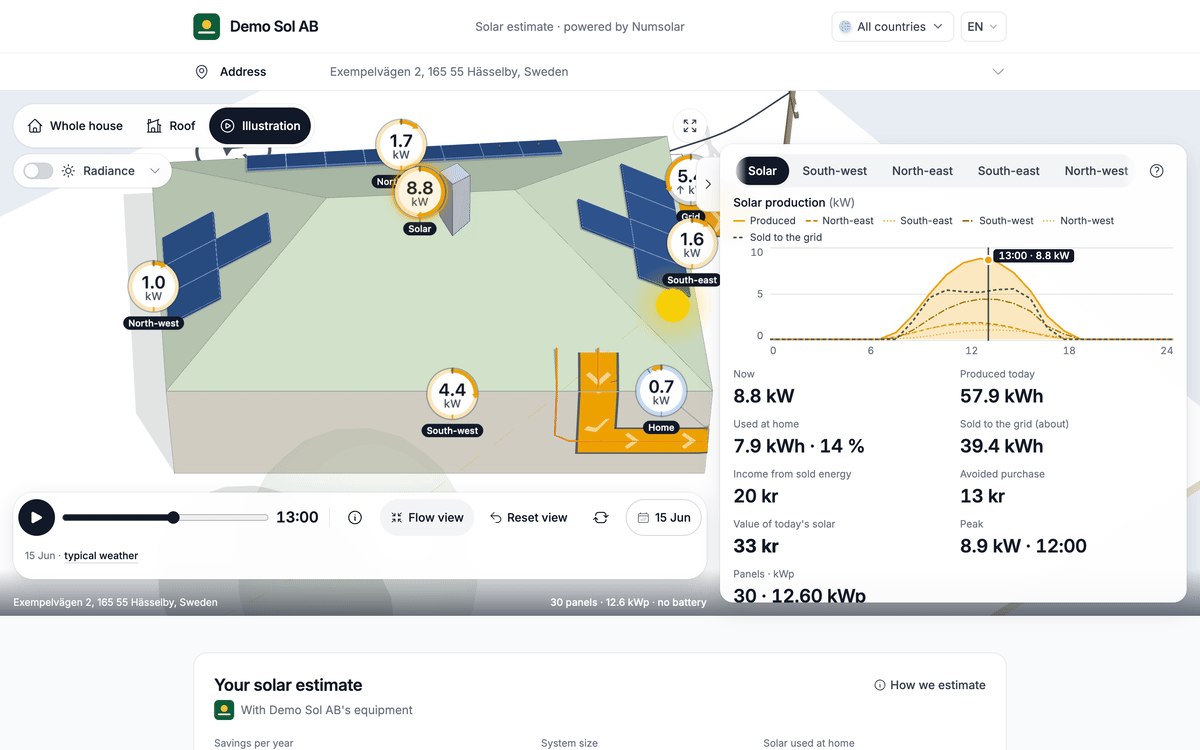
We follow the sun across one typical day per month, in 15-minute steps, and check what shades each panel: the house itself, roof objects and trees. The Radiance view colours the roof by the sunlight it gets, per month or for the year, and shows what each panel makes per day.
Sunlight and temperature come from PVGIS, the EU's satellite record, read for your house from a 0.25° × 0.5° grid over Sweden. Our yield model is within ±5 % of PVGIS at all 39 test points.
Your electricity price, hour by hour
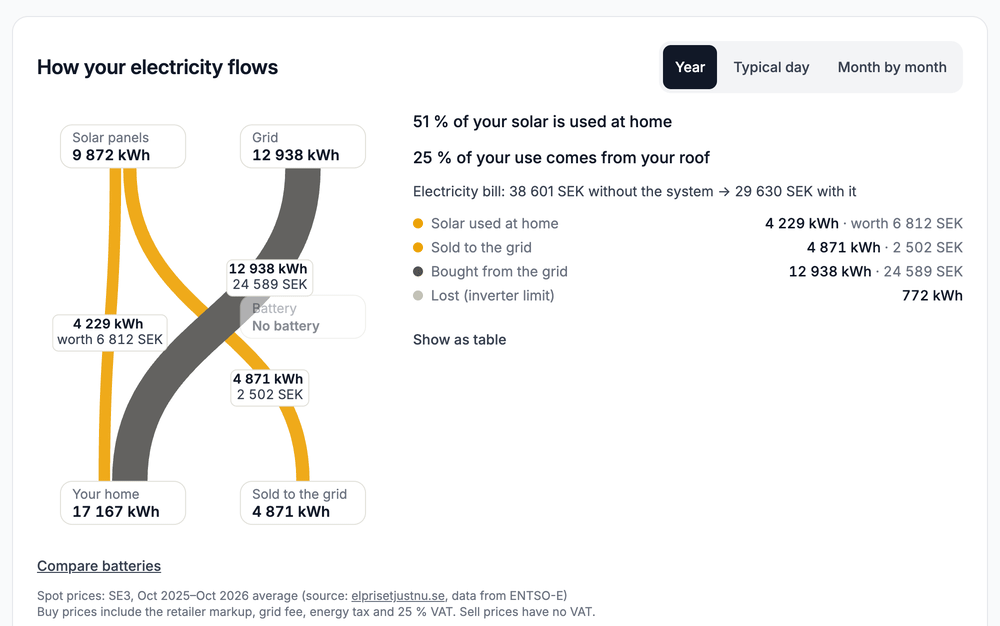
Each hour gets its own price: the average spot price for that hour and month in your price area (SE1–SE4) over the last 12 months, plus your supplier's markup, the grid fee, energy tax and VAT. Solar you use at home saves that price; solar you sell earns the spot price. Every number can be changed by hand.
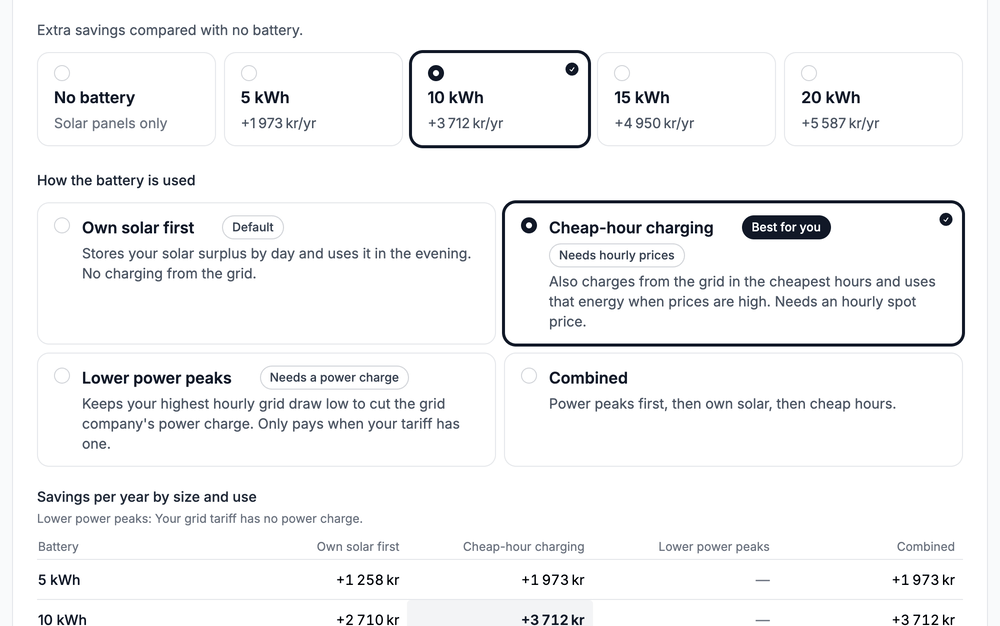
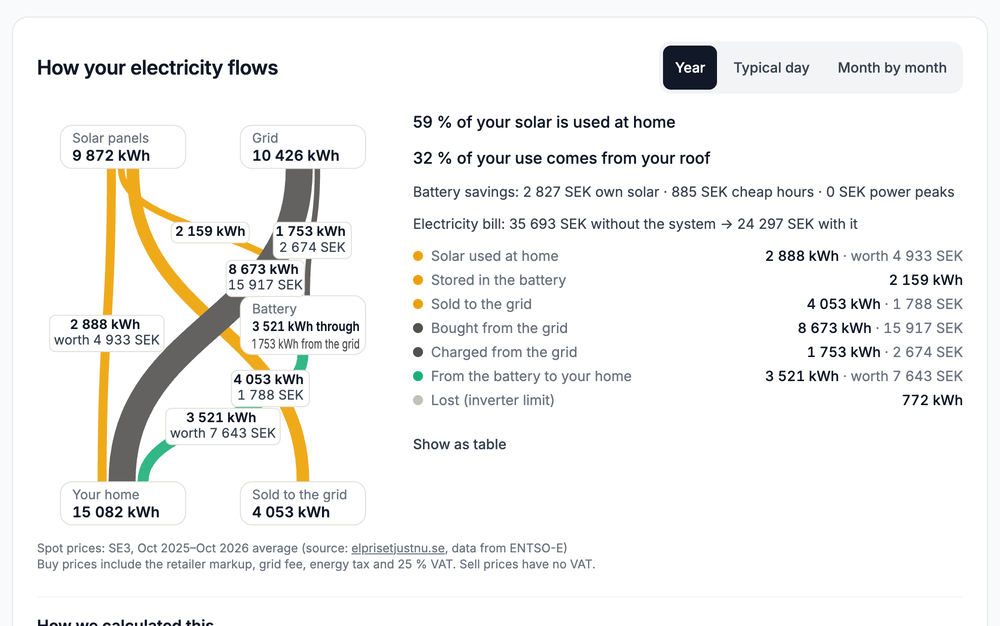
Own solar first, cheap-hour charging, lower power peaks (for an effekttariff) or combined. We simulate every battery size with every strategy over all 8 760 hours of the year and pick the one that saves the most at your prices. Each battery loses 10 % per round trip and keeps a 10 % reserve.
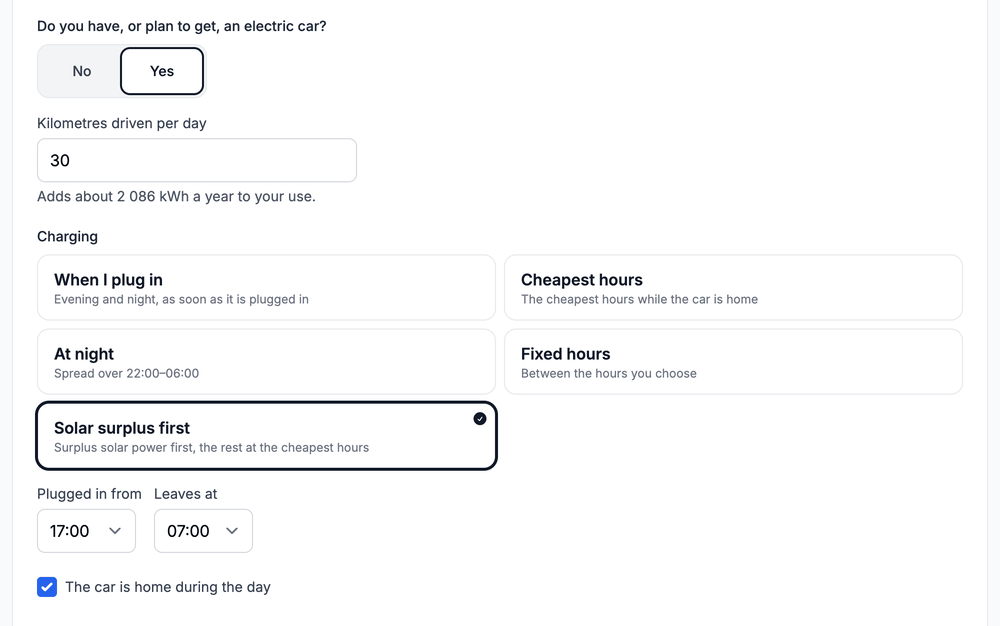
When you plug in, cheapest hours, at night (22–06), fixed hours you set, or solar surplus first. A table shows the cost per year of all five and the share of the charging that comes from your roof.
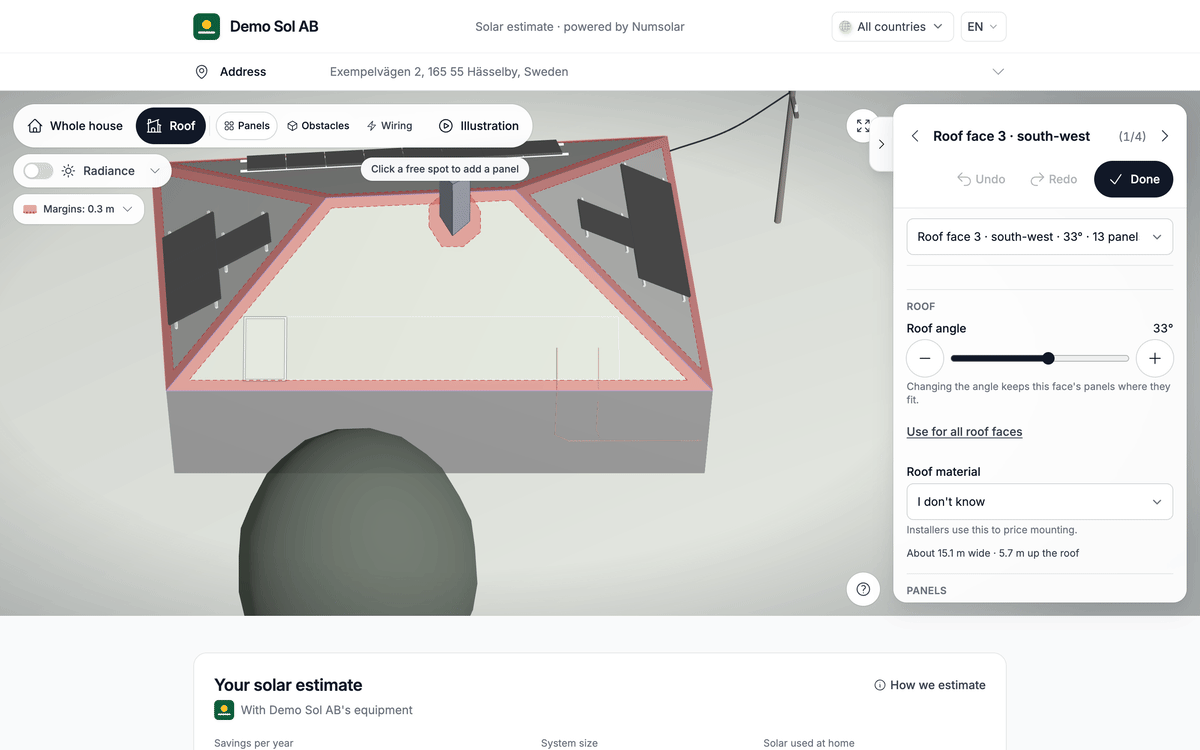
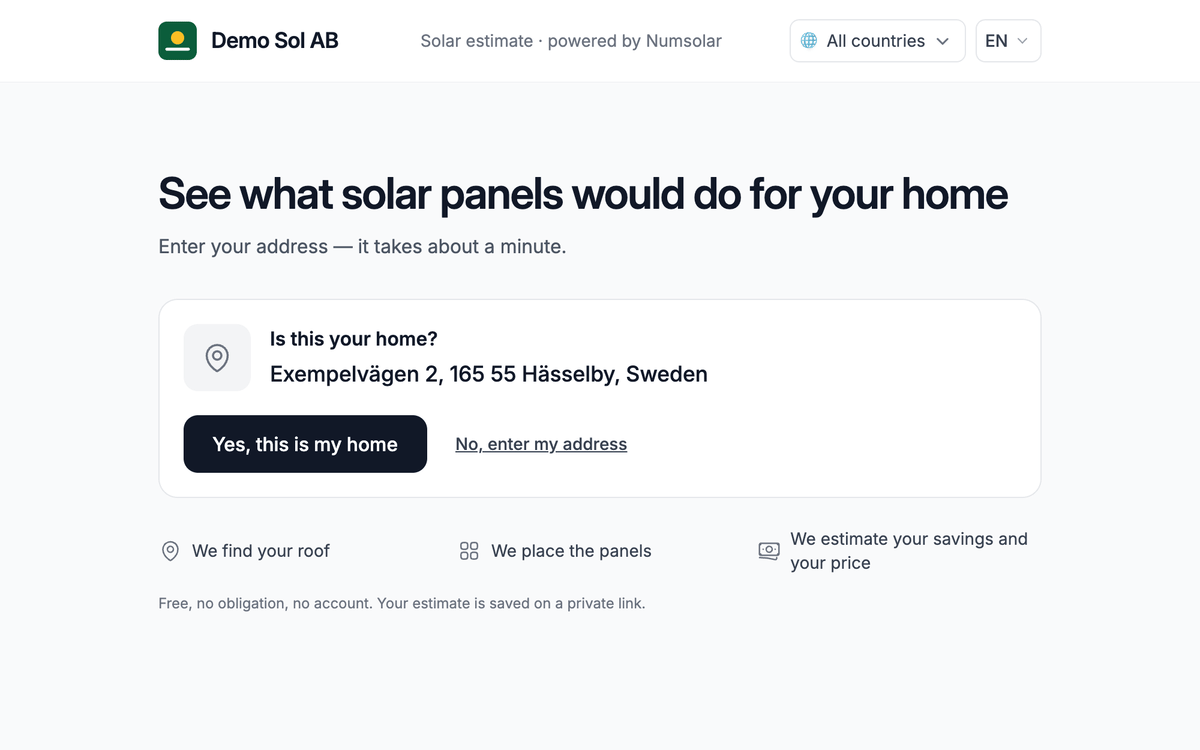
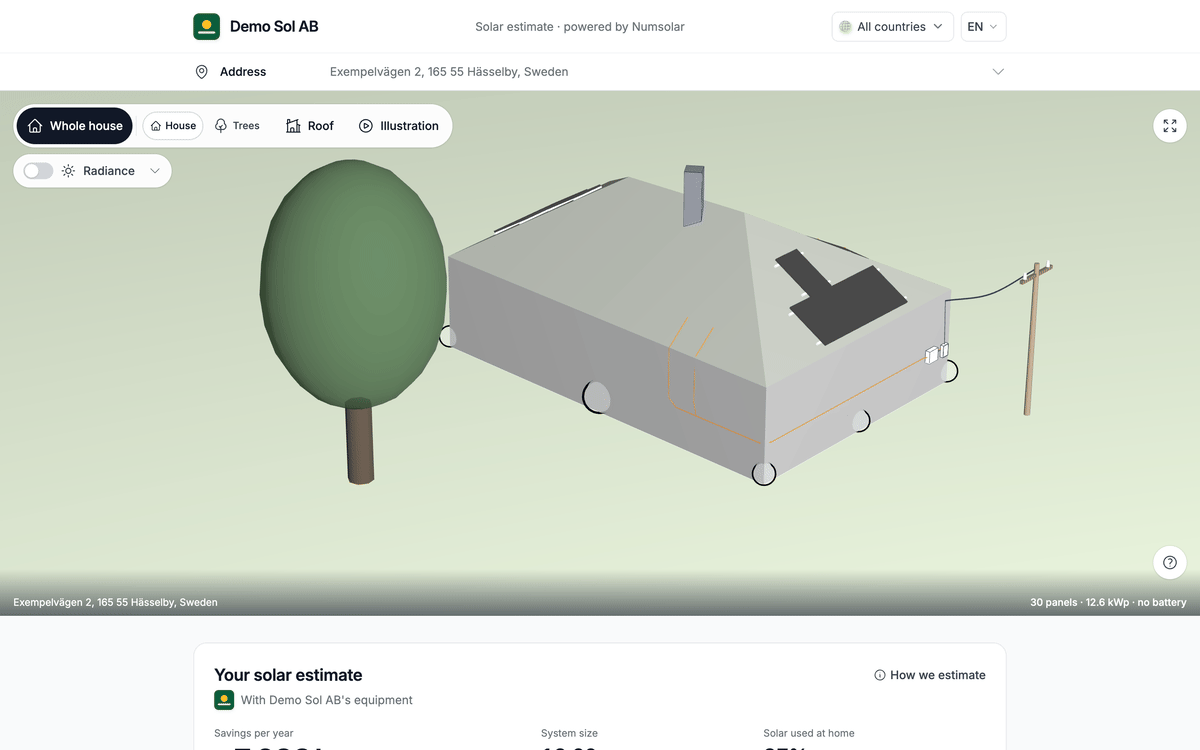
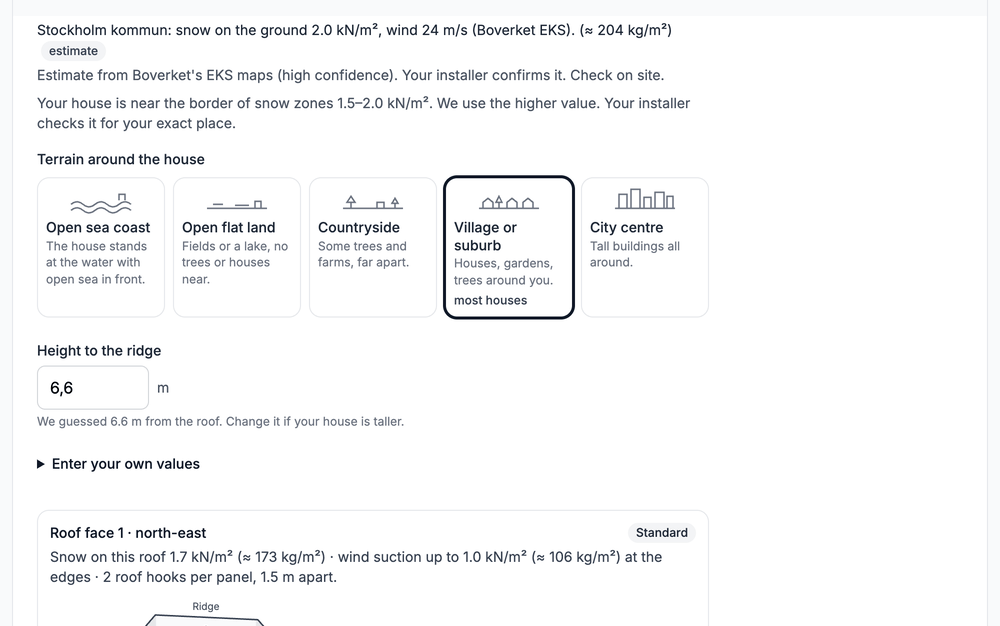
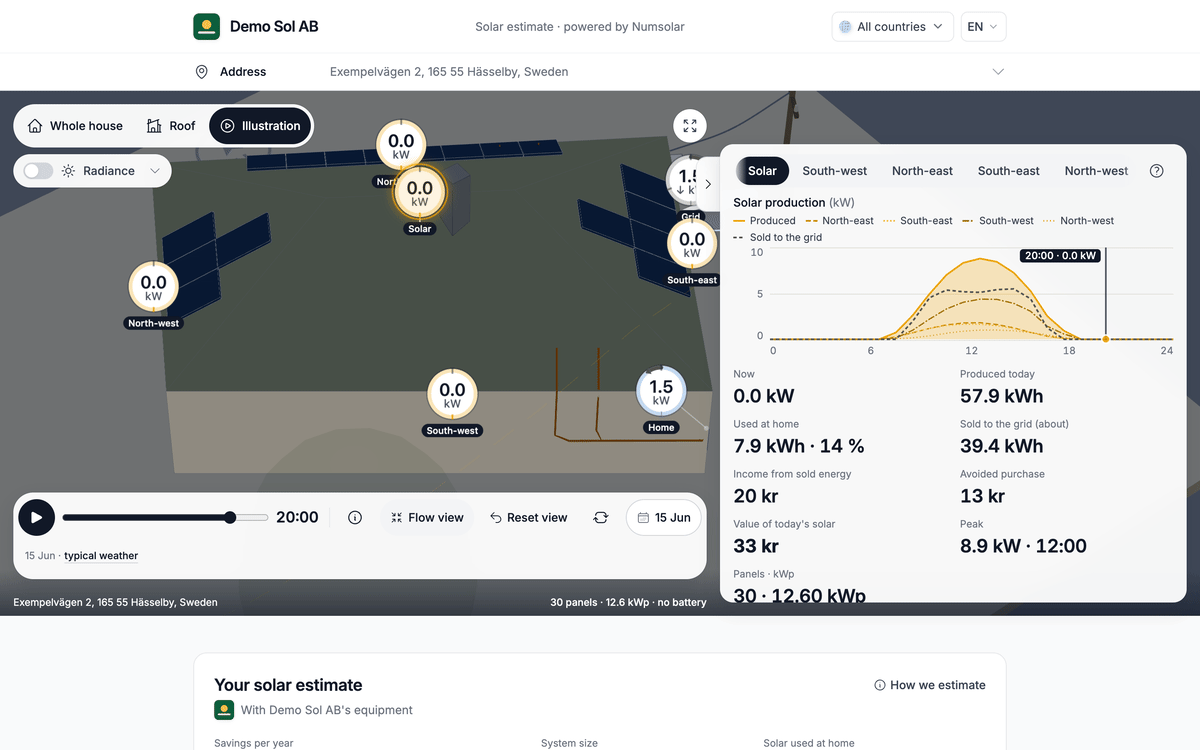
Screenshots of the configurator with a test house and a made-up installer, Demo Sol AB. Your own run looks the same, with your roof.
1
Your address
Type it and pick it from the suggestions. We find the house on the map with Google.
2
The roof, drawn by AI
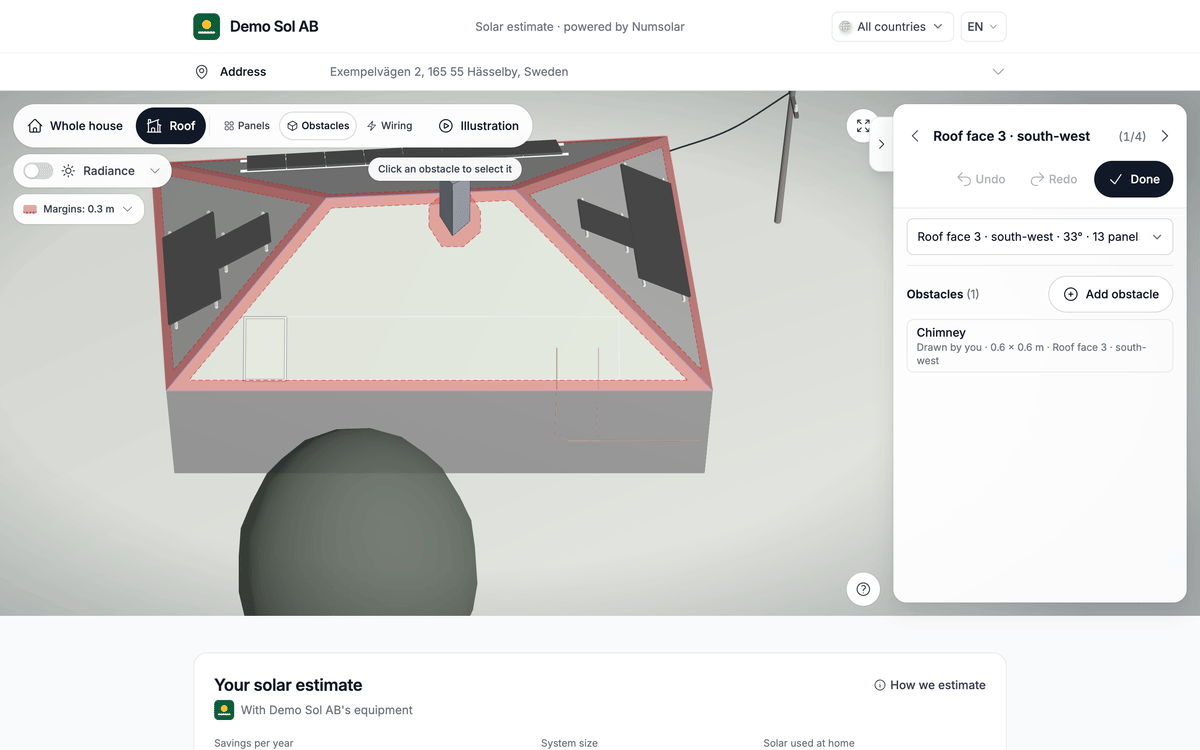
An AI model finds the roof faces on the aerial photo. We rebuild them in 3D and look for chimneys, skylights and trees around the house. Usually about a minute. The picture shows the test house on a plain ground, not the aerial photo.
3
Roof faces and panels
Each face gets its tilt, direction and size; you can change the tilt or the roof material. Panels go on the faces that point south, east or south-west, with a margin from every edge and roof object. Add or remove panels one by one.
4
Snow and wind
Snow and wind loads for your house come from Boverket's EKS maps and go to the installer with your request. An estimate; the installer confirms it on site.
5
Shade from roof objects and trees
We follow the sun through the day and check what shades each panel. Obstacles: chimneys, vents and skylights are solid blocks with a height (a chimney 1.2 m unless you change it). Trees: each one gets an estimated height and crown; a crown lets 15 % of the light through, all year. Radiance: the roof coloured by sunlight, per month or for the year.
6
The sun every 15 minutes, the energy every hour
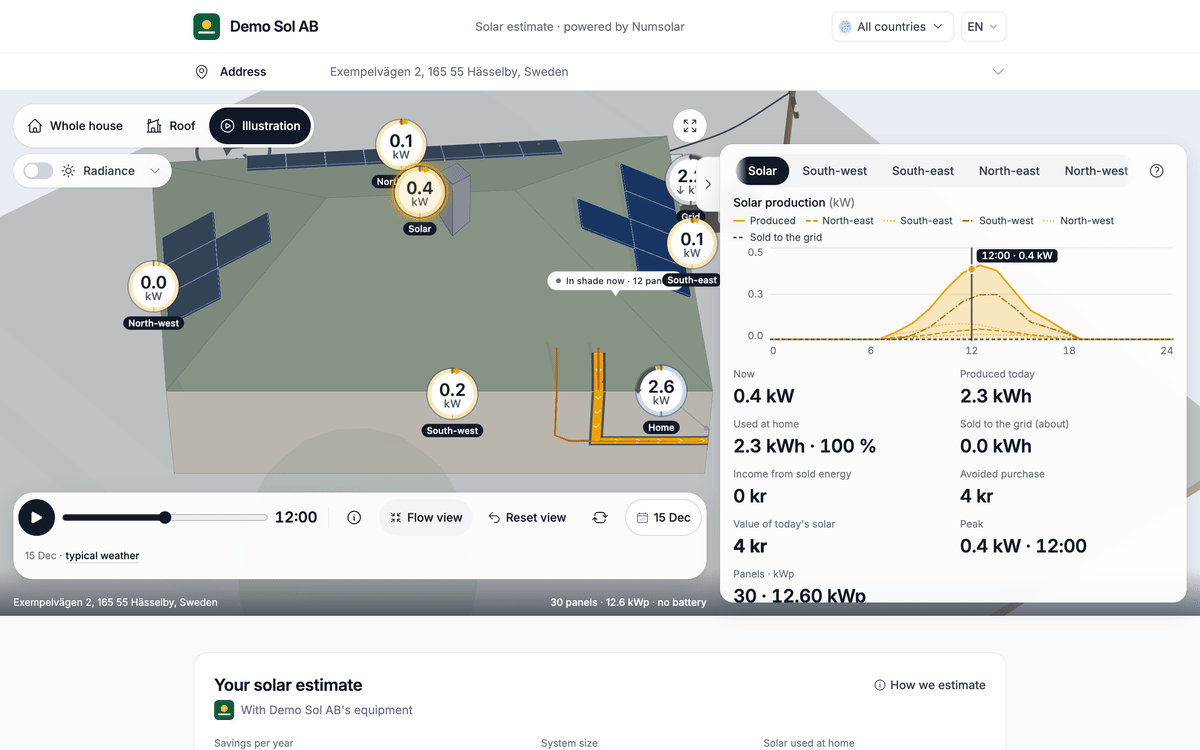
The sun's path, the shade and the light on each panel are computed every 15 minutes of one typical day per month, 12 × 96 steps; the sunlight comes from PVGIS data for your area. Your home, the battery, the car and the prices then run hour by hour, all 8 760 hours of the year.
7
What the electrician gets
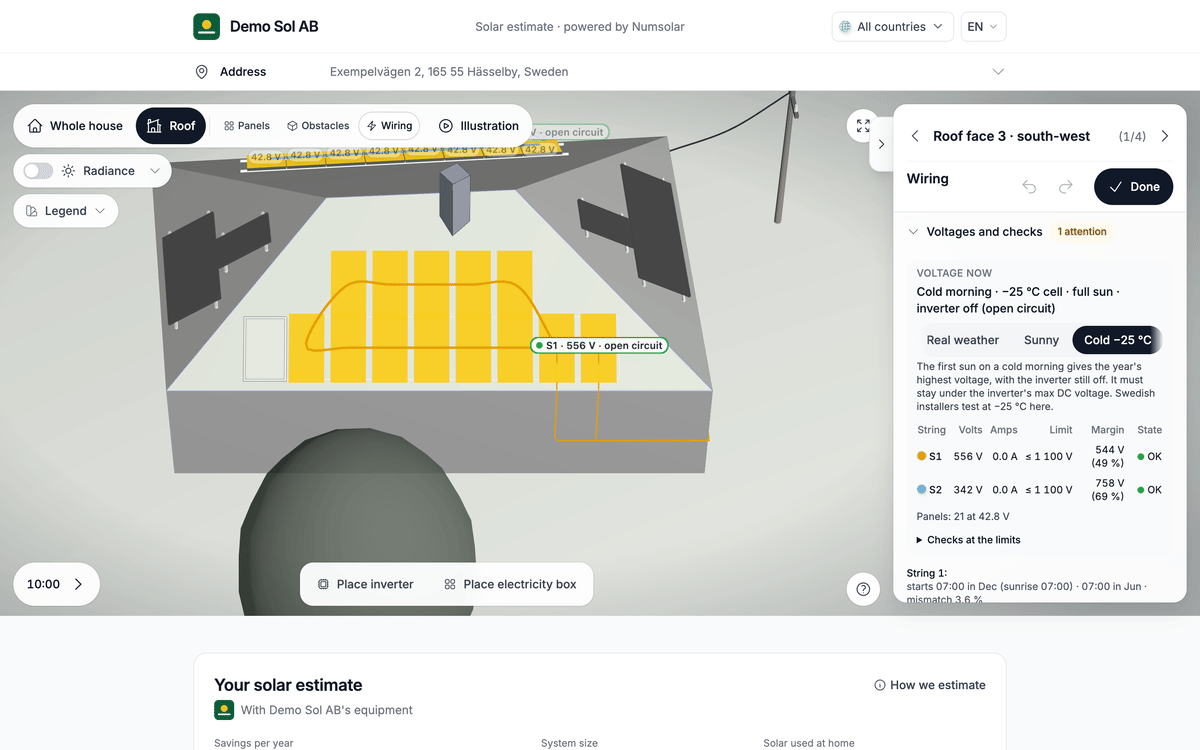
We connect the panels in strings to the inverter's inputs and route the cable round roof objects. Each string's voltage is checked at −25 °C (colder further north) and with the panels at 70 °C. Your installer's electrician gets this as a PDF with your request. A planning estimate; the registered electrical installation company makes the final design.
8
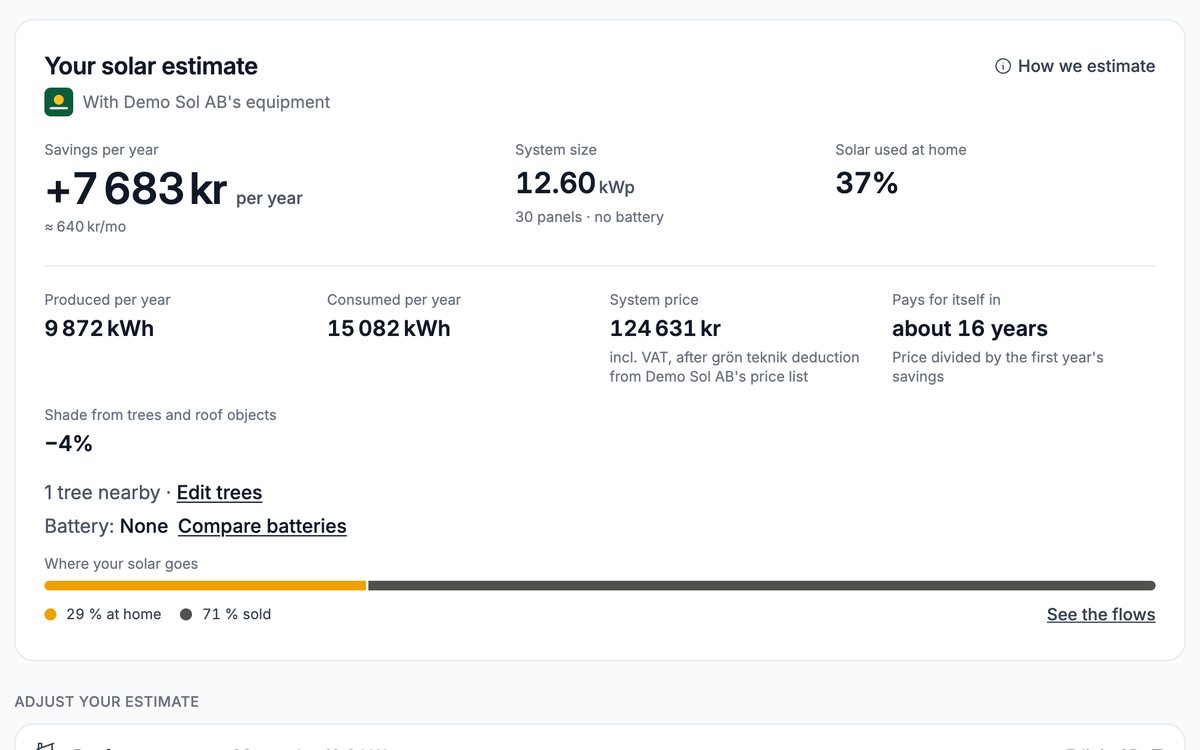
The savings, in kronor
Each hour gets its price: the average spot price for that hour and month in your price area over the last year, plus markup, grid fee, energy tax and VAT. Solar used at home saves that price; solar sold earns the spot price. A battery and an electric car are simulated the same way.
Example
9
A battery, four ways
“Own solar first”, “Cheap-hour charging”, “Lower power peaks” (for an effekttariff) and “Combined”. We pick the one that saves the most at your prices and show the saving per year for each size. Every battery loses 10 % per round trip and keeps a 10 % reserve.
Example
10
An electric car, five ways to charge
“When I plug in” (evening and night), “Cheapest hours” while the car is home, “At night” (22:00–06:00), “Fixed hours” you set, and “Solar surplus first”, then the cheapest hours. A table compares the cost per year of all five.
Example
11
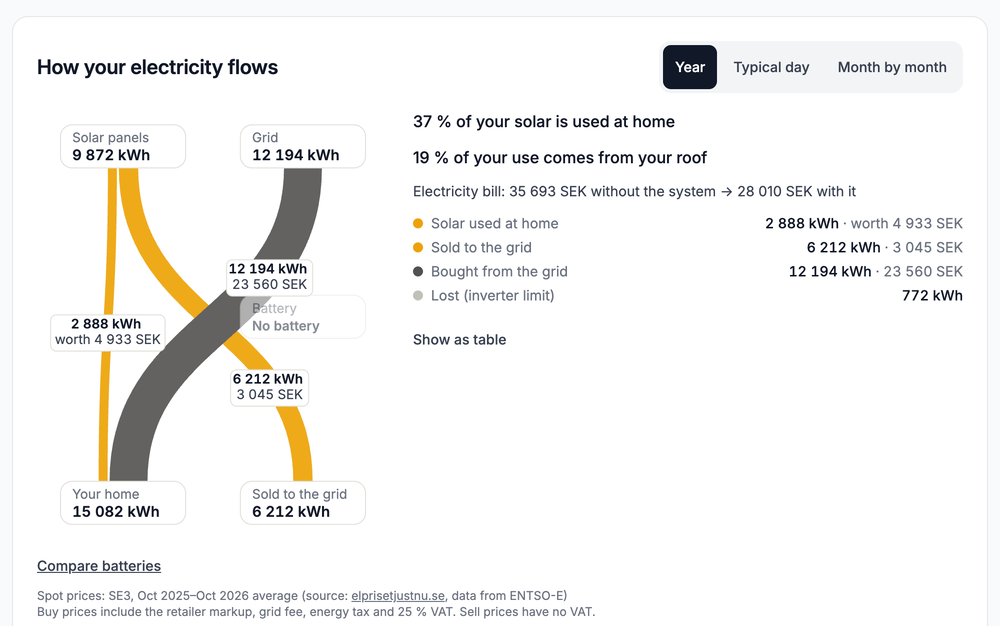
How much solar you use yourself
Self-use: the share of the solar you do not sell. Self-sufficiency: the share of your use that comes from the roof, directly or via the battery. Example: panels only 25 % self-use; with a car that charges on solar 38 %; with a 10 kWh battery 45 %.
12
Installer prices for your roof
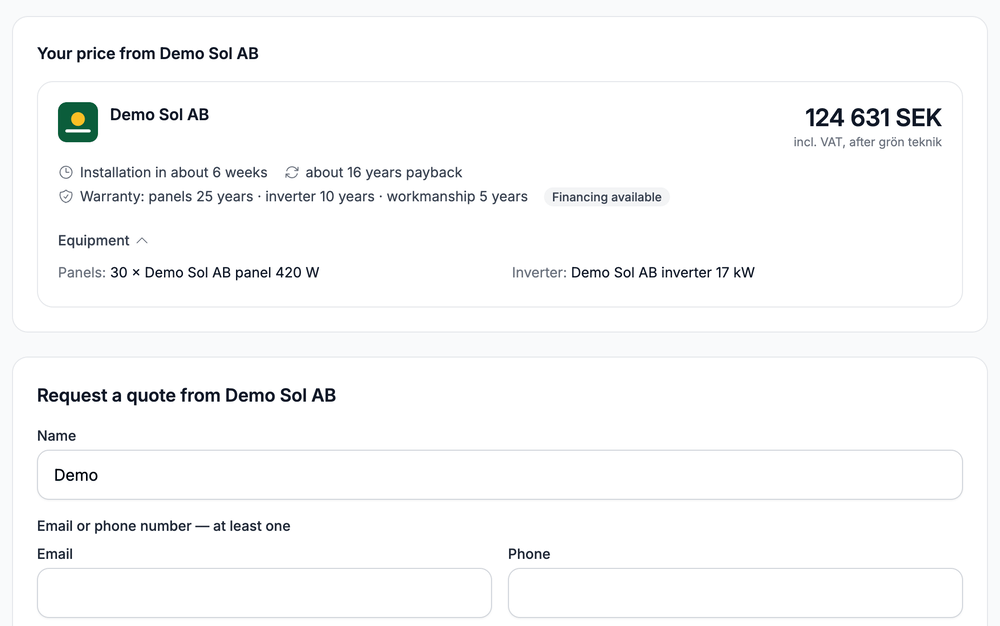
Every listed installer that serves your address prices your system from its own price list: total incl. VAT after the grön teknik deduction, payback in years, waiting time, warranties and equipment. Cards are sorted by price. Nobody pays for placement.
13
Send your request to up to three
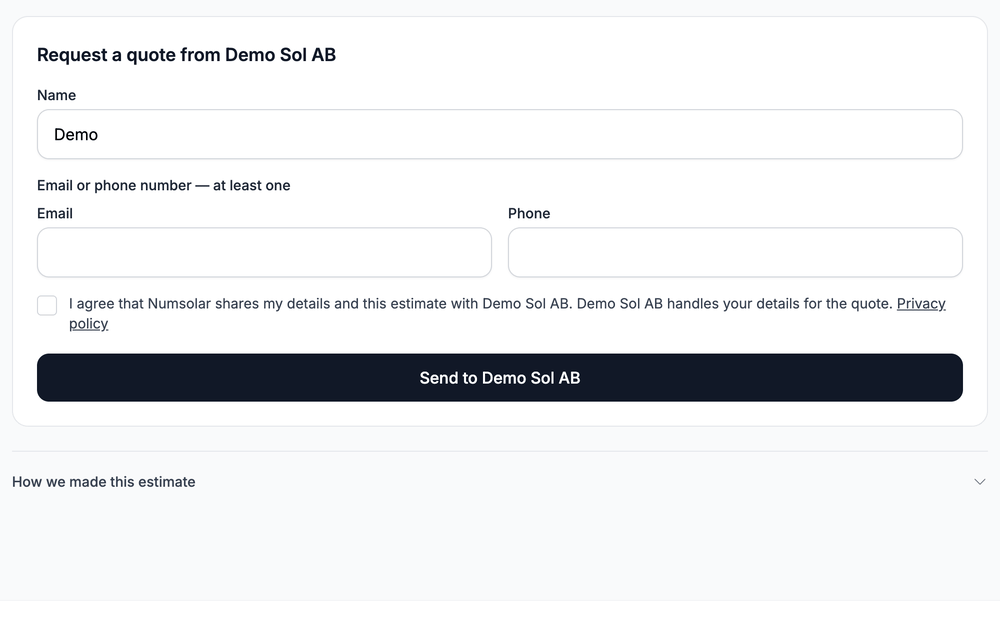
Tick the installers you want, leave a name and an email or phone number. Each one gets your roof in 3D, your system and the estimate, and answers you by email. Nothing goes to anyone you did not tick.
Installers who list on Numsolar enter their own packages and prices. When your roof is done, every listed installer that serves your address prices your system: panels, inverter, battery if you chose one, mounting, labour and VAT, after the grön teknik deduction. The cards are sorted by price and show the total, payback in years, waiting time in weeks, warranties and the equipment. When at least three installers can price your system you also see a typical price: the average of all of them (from five, with the highest and lowest dropped). Nobody pays for placement.
Send your request to up to three
Tick up to three installers. Each one gets your roof in 3D, your system, the estimate, and your name and email or phone number — nothing else, and nothing goes to anyone you did not tick. The installer answers you by email. We do not call you and we do not sell your details. Change the panels, the battery or the car later and the cards re-price as you go.
Installers near you
Under the cards you also see companies from our directory of Swedish solar installers that serve your area, with the facts the company publishes. “Verified details” marks a company whose details we checked against public registers.
Solar panels: 15 % of labour and material. A battery for your own solar, or an EV charger: 50 %. At most 50 000 kr per person and year, for all three together. On a fixed-price installation 97 % of the price counts as labour and material. The installer takes the deduction off your invoice and claims it from Skatteverket; you must be 18 and own the house. Every price on Numsolar is shown after the deduction. The 60 öre/kWh tax credit for sold electricity ended on 1 January 2026; we do not count it.
Numsolar's Swedish starter kit, which every new installer starts from, applies exactly these Skatteverket rules (rule set version 3, checked 11 October 2026).
Panels, inverter, mounting, labour and VAT; a battery and an EV charger when you chose them. The total is after the grön teknik deduction. Payback is the price divided by the first year's savings, with no interest and no price rise. Warranties come from the installer's own catalogue: panels, inverter, battery and workmanship, in years. “Financing available” shows when the installer offers it. The installer confirms the roof and the mounting on site.
Depends on the roof. Type your address: listed installers price the system for your roof in about a minute, after the grön teknik deduction. The card shows the total, the payback in years and the warranties.
How much electricity do solar panels produce in Sweden?+
A house with 20 panels on a 35° south roof makes about 8,300 kWh a year in Stockholm – worth about SEK 15,000 at the last 12 months' electricity prices. Your roof's tilt, direction and shade move the number; the estimate uses all three.
City
Panels
kWh a year
Worth a year
Malmö (SE4)
20
8,900
SEK 18,000
Stockholm (SE3)
20
8,300
SEK 15,000
Luleå (SE1)
20
7,900
SEK 11,000
20 panels × 420 W = 8.4 kWp on a 35° south roof; PVGIS data, 14 % system loss. Worth: the price area's average spot price over the last 12 months plus markup, grid fee, energy tax and VAT. Prices as of 2026-10-15.
Does my roof have to face south?+
No. A 35° east or west roof makes about 76 % of a south one in Stockholm. We place panels on faces that point south, east or south-west and show each face's yield.
What is grön teknik?+
A tax reduction taken off the invoice: 15 % for solar panels, 50 % for a battery or an EV charger, at most 50 000 kr per person and year. Our prices are after the deduction.
How do you make a 3D model of my roof?+
An AI model reads the aerial photo and marks the roof faces, chimneys, skylights and trees. We rebuild the faces in 3D with their tilt, direction and size. You can correct any of it.
Should I add a battery?+
Try it: the estimate simulates 5, 10, 15 and 20 kWh with four strategies over the whole year at your prices and shows the saving per year for each size. The installer cards price each size after the 50 % deduction, so the payback per size is on your card.
Does it cost anything, and do I commit to anything?+
No and no. No account, no card, no call. A request goes only to the installers you tick, and the installer answers you by email.
Where do the numbers come from?+
Sunlight and temperature: PVGIS. The roof: Google's aerial photo and an AI model. Prices: the last 12 months of day-ahead spot prices in your price area, plus grid fee, tax and VAT. Loads: Boverket's EKS maps. Installer prices: each installer's own price list. The method is public: the same engine runs behind our open API.
Example
See it for your roof
About a minute. Free, no account.
Cookies for visitor statistics
We use Google Analytics to count visits. It sets a cookie only if you accept. Server-side statistics without cookies run either way.
Privacy policy